Switch to english version


Rekordanteil – Erneuerbarer Energien Management – Bild: ConceptCafe|Shutterstock.com
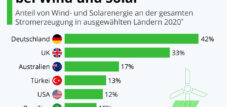
Nettostromerzeugung im 1. Halbjahr 2020: Das Fraunhofer-Institut für Solare Energiesysteme ISE hat am 01. Juli die Daten zur öffentlichen Nettostromerzeugung für das erste Halbjahr 2020 vorgestellt, die aus der Datenplattform Energy-Charts hervorgehen. Mit einem Anteil von 55,8 Prozent an der Nettostromerzeugung zur öffentlichen Stromerzeugung – also dem Strommix, der aus der Steckdose kommt – stellten die erneuerbaren Energien einen neuen Rekordwert auf. Im Februar lag ihr Anteil sogar bei 61,8 Prozent. Solar- und Windenergieanlagen speisten gemeinsam 102,9 Terawattstunden (TWh) in das öffentliche Netz ein, gegenüber 92,3 TWh im ersten Halbjahr 2019. Die Stromproduktion aus Kohle ging dagegen stark zurück: der Anteil der Braunkohle sank auf 13,7 Prozent, Steinkohle kommt nur noch auf 6 Prozent. Die Windenergie war mit einem Anteil von 30,6 Prozent erneut stärkste Energiequelle.
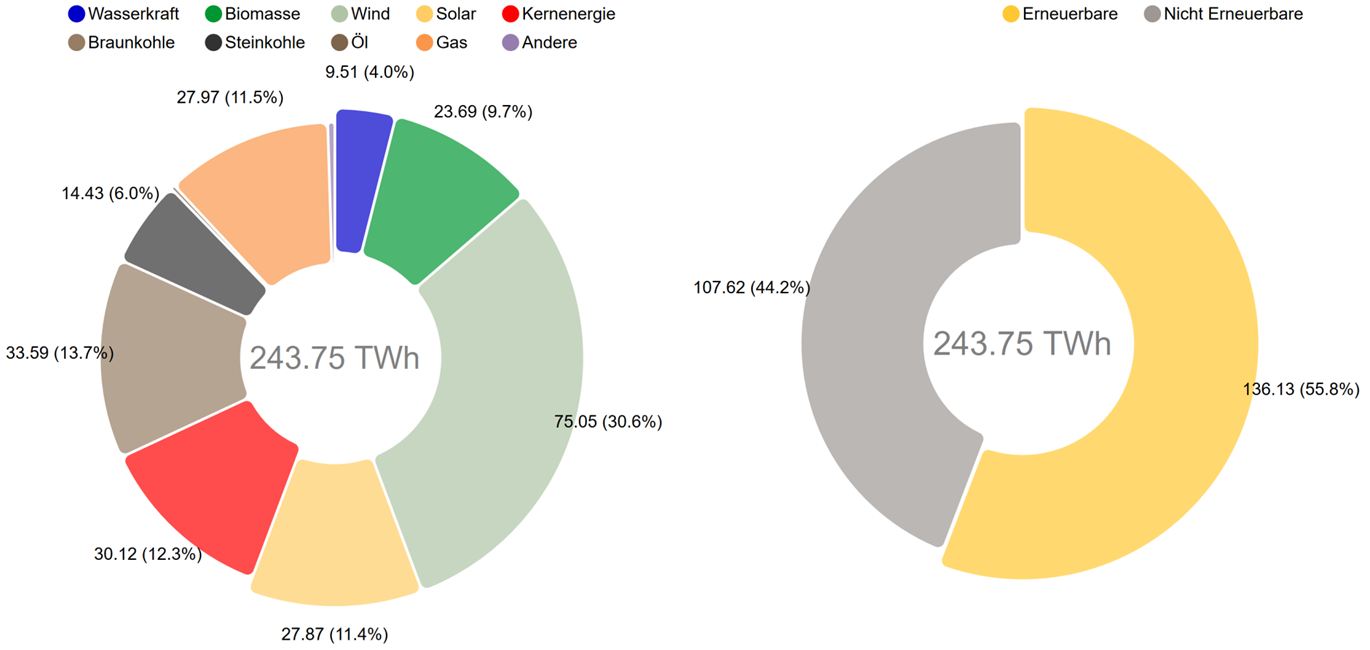
Nettostromerzeugung aus Kraftwerken zur öffentlichen Stromversorgung – © Fraunhofer ISE, Grafik: B. Burger, Quelle: https://www.energy-charts.de
Die Grafik oben zeigt die Nettostromerzeugung aus Kraftwerken zur öffentlichen Stromversorgung. Das ist der Strommix, der tatsächlich aus der Steckdose kommt. Die Erzeugung aus Kraftwerken von »Betrieben im verarbeitenden Gewerbe sowie im Bergbau und in der Gewinnung von Steinen und Erden«, d. h. die industrielle Erzeugung für den Eigenverbrauch, ist bei dieser Darstellung nicht berücksichtigt.
Folgen der Corona- Pandemie spürbar
Ab dem zweiten Quartal 2020 machte sich die gesunkene Stromnachfrage aufgrund der durch die Corona-Pandemie rückläufigen Industrieproduktion bemerkbar. Die Last ging zurück auf 35,3 TWh im Juni (Juni 2019: 37,6 TWh), die Stromproduktion sank von 47,9 TWh im Januar auf 36,0 TWh im Juni. Insgesamt lag die Last im ersten Halbjahr bei 234,2 TWh, ein deutlicher Rückgang gegenüber den 245,7 TWh im ersten Halbjahr 2019. Die Stromproduktion ging gegenüber dem ersten Halbjahr 2019 um 21,7 TWh zurück auf 243,8 TWh. Ein Teil dieses Rückgangs ist auf die von 20,1 TWh auf 7,5 TWh gesunkenen Exporte zurückzuführen.
Erneuerbare Energien getrieben von starkem Wind
Photovoltaikanlagen speisten im ersten Halbjahr ca. 27,9 TWh in das öffentliche Netz ein, eine Steigerung von 11,2 Prozent gegenüber dem Vorjahr (25,1 TWh). Die Solarstromanlagen profitierten dabei von den günstigen Wetterverhältnissen, die von April bis Juni jeweils mehr als 6 TWh Stromproduktion pro Monat erlaubten.
Die Windenergie produzierte in der ersten Jahreshälfte 2020 ca. 75 TWh und lag damit etwa 11,7 Prozent über der Produktion im ersten Halbjahr 2019 (67,2 TWh). Durch die zahlreichen Winterstürme stieg ihr Anteil im Februar sogar auf 45 Prozent der Nettostromerzeugung. Die Wasserkraft produzierte im ersten Halbjahr ca. 9,5 TWh, ein Minus von 9 Prozent im Vergleich zum Vorjahr (10,5 TWh). Aus Biomasse wurden ca. 23,7 TWh produziert, ein leichter Anstieg gegenüber dem Vorjahr.
In Summe produzierten die erneuerbaren Energiequellen Solar, Wind, Wasser und Biomasse im ersten Halbjahr 2020 ca. 136,1 TWh (Vorjahr: 125,6 TWh). Der Anteil an der öffentlichen Nettostromerzeugung, d. h. dem Strommix, der tatsächlich aus der Steckdose kommt, liegt bei ca. 55,8 Prozent, ein starker Anstieg gegenüber 2019 (47 Prozent). Der Anteil der Erneuerbaren Energien an der gesamten Bruttostromerzeugung liegt erstmals über 50 Prozent. Die Bruttoerzeugung enthält auch die Eigenerzeugung der Industrie (Betriebe im verarbeitenden Gewerbe sowie im Bergbau und in der Gewinnung von Steinen und Erden) sowie die internen Verluste der konventionellen Kraftwerke. Beide Anteile werden nicht in das öffentliche Stromnetz eingespeist.
Kohlestrom stark rückläufig- »Fuel Switch« zu Erdgas
Die Nettostromproduktion aus Kernkraftwerken betrug im ersten Halbjahr 2020 ca. 30,1 TWh, ein Rückgang um 12,9 Prozent gegenüber dem Vorjahresniveau (34,6 TWh). Braunkohlekraftwerke produzierten ca. 33,6 TWh netto. Das sind 19,1 TWh bzw. 36,3 Prozent weniger als im ersten Halbjahr 2019. Die Nettoproduktion aus Steinkohlekraftwerken brach um 46 Prozent auf nur noch 14,4 TWh ein. Der starke Rückgang ist bedingt durch die gestiegenen Kosten für CO₂-Zertifikate, die durchschnittlich bei 21,91 Euro pro Tonne CO₂ lagen, und den stark gesunkenen Day-Ahead Börsenstrompreises von durchschnittlich 22,94 Euro/MWh (gegenüber 36,83 Euro/MWh in 2019). Bei einer Emissionen-Belastung von etwa 1 Tonne CO₂ pro erzeugter Megawattstunde Kohlestrom war die Wirtschaftlichkeit von Kohlekraftwerken kaum mehr gegeben.
Da sich der Preis für Erdgas im gleichen Zeitraum halbierte (8,03 Euro/MWh statt 16,38 Euro in 2019) und Erdgaskraftwerke geringere CO₂-Zertifikatskosten haben, fand ein »Fuel Switch« von Kohle zu Erdgas statt.
Gaskraftwerke haben ihre Produktion auf 28 TWh gesteigert, ein Plus von 13,9 Prozent gegenüber den 24,6 TWh im Vorjahr. Neben den Kraftwerken zur öffentlichen Stromversorgung gibt es auch Gaskraftwerke im Bergbau und verarbeitenden Gewerbe zur Eigenstromversorgung. Diese produzierten zusätzlich ca. 20 TWh für den industriellen Eigenbedarf.
Stromverbrauch und die Netzverluste 2015 bis 2020

Stromverbrauch und die Netzverluste 2015 bis 2020 – © Fraunhofer ISE, Grafik: B. Burger, Quelle: https://www.energy-charts.de
Vergleich der Last von Januar bis Juni in den Jahren 2015 bis 2020. Die Last beinhaltet den Stromverbrauch und die Netzverluste, aber nicht den Pumpstromverbrauch und den Eigenverbrauch der konventionellen Kraftwerke.
Anteil Erneuerbarer Energien zur Nettostromerzeugung 2002 – 2020
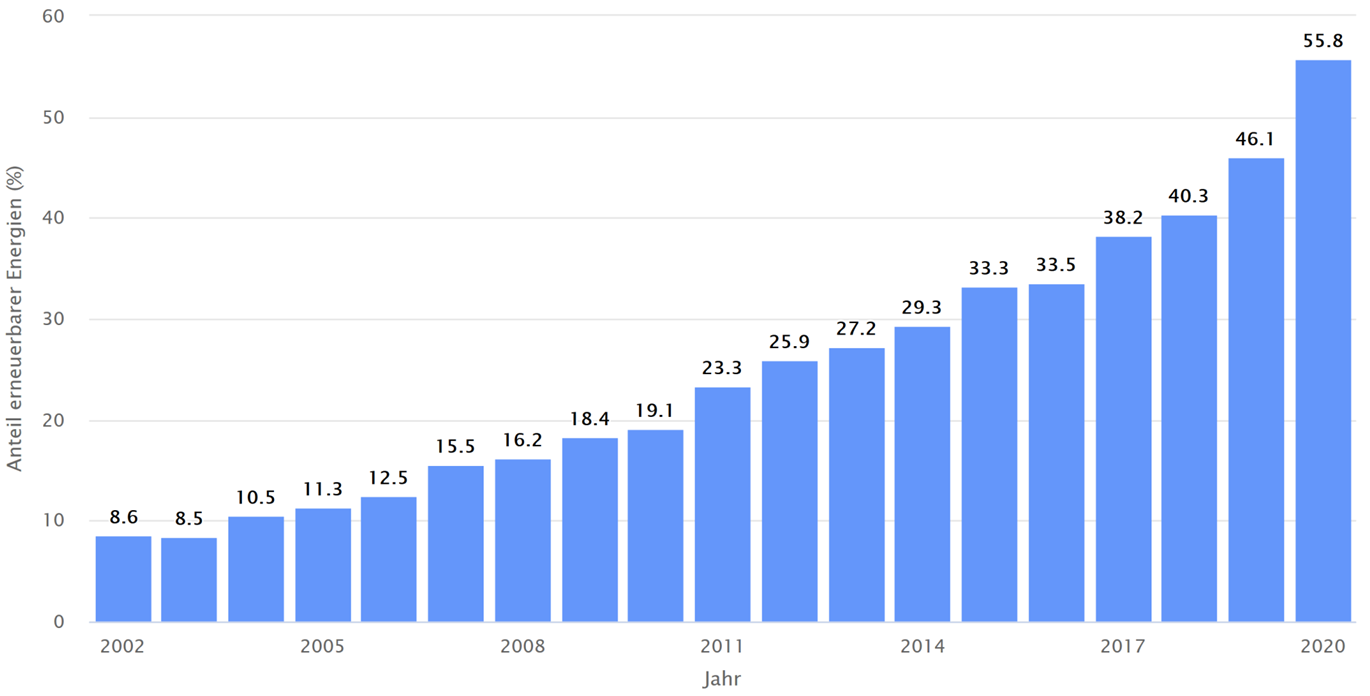
Anteil Erneuerbarer Energien zur Nettostromerzeugung – © Fraunhofer ISE, Grafik: B. Burger, Quelle: https://www.energy-charts.de
Net electricity generation in the first half of 2020: On July 1, the Fraunhofer Institute for Solar Energy Systems ISE presented the data on public net electricity generation for the first half of 2020, which are derived from the Energy Charts data platform. With a 55.8 percent share of net electricity generation in public power generation – i.e. the electricity mix that comes out of the socket – renewable energies set a new record. In February, their share was as high as 61.8 percent. Solar and wind power plants together fed 102.9 terawatt hours (TWh) into the public grid, compared with 92.3 TWh in the first half of 2019. In contrast, electricity production from coal fell sharply: the share of lignite fell to 13.7 percent, while hard coal now accounts for only 6 percent. Wind power was again the strongest source of energy, accounting for 30.6 percent.
Net electricity generation from power plants for public power supply – © Fraunhofer ISE, graphic: B. Burger, source: https://www.energy-charts.de
The chart above shows the net electricity generation from power plants for public supply. This is the electricity mix that actually comes out of the socket. The generation from power plants of „companies in the manufacturing industry as well as in mining and quarrying“, i.e. industrial generation for own consumption, is not included in this figure.
Consequences of the corona pandemic noticeable
From the second quarter of 2020, the lower demand for electricity became noticeable due to the decline in industrial production caused by the corona pandemic. Load dropped to 35.3 TWh in June (June 2019: 37.6 TWh), while electricity production fell from 47.9 TWh in January to 36.0 TWh in June. In total, the load in the first half of the year was 234.2 TWh, a significant decrease from 245.7 TWh in the first half of 2019. Electricity production fell by 21.7 TWh to 243.8 TWh compared to the first half of 2019. Part of this decline is attributable to the drop in exports from 20.1 TWh to 7.5 TWh.
Renewable energies driven by strong wind
In the first half of the year, photovoltaic systems fed approx. 27.9 TWh into the public grid, an increase of 11.2 percent compared with the previous year (25.1 TWh). The solar power systems benefited from the favorable weather conditions, which allowed more than 6 TWh of electricity to be produced per month from April to June.
Wind power produced about 75 TWh in the first half of 2020 and was thus about 11.7 per cent above the production in the first half of 2019 (67.2 TWh). Due to the numerous winter storms, its share even rose to 45 percent of net electricity generation in February. Hydroelectricity production in the first half of the year was approximately 9.5 TWh, down 9 percent from 10.5 TWh in the prior-year period. Approximately 23.7 TWh were produced from biomass, a slight increase compared to the previous year.
In total, the renewable energy sources solar, wind, hydro and biomass produced approx. 136.1 TWh in the first half of 2020 (previous year: 125.6 TWh). The share of public net electricity generation, i.e. the electricity mix that actually comes out of the socket, is approx. 55.8 percent, a sharp increase compared to 2019 (47 percent). The share of renewable energies in total gross electricity generation exceeds 50 percent for the first time. Gross generation also includes the industry’s own production (companies in the manufacturing sector as well as in mining and quarrying) and the internal losses of conventional power plants. Both shares are not fed into the public power grid.
Coal-fired power sharply declines- „Fuel Switch“ to natural gas
Net electricity generation from nuclear power plants amounted to approx. 30.1 TWh in the first half of 2020, a decline of 12.9 percent compared to the previous year’s level (34.6 TWh). Lignite-fired power stations produced approx. 33.6 TWh net. This is 19.1 TWh or 36.3 percent less than in the first half of 2019. Net production from hard coal-fired power stations slumped 46 percent to just 14.4 TWh. This sharp decline is due to the increased cost of CO₂ certificates, which averaged Euro 21.91 per ton CO₂, and the sharp drop in the day-ahead exchange electricity price of Euro 22.94/MWh on average (compared with Euro 36.83/MWh in 2019). With an emission load of about 1 ton CO₂ per generated megawatt hour of coal-fired electricity, the economic viability of coal-fired power plants was hardly given.
As the price for natural gas halved in the same period (8.03 Euro/MWh instead of 16.38 Euro in 2019) and natural gas power plants have lower CO₂ certificate costs, a „fuel switch“ from coal to natural gas took place.
Gas-fired power stations increased their production to 28 TWh, an increase of 13.9 percent compared with the 24.6 TWh in the previous year. In addition to the power plants for public electricity supply, there are also gas-fired power plants in the mining and manufacturing industries to supply their own electricity. These also produced an additional 20 TWh for the company’s own industrial needs.
Electricity consumption and grid losses 2015 to 2020
Power consumption and grid losses 2015 to 2020 – © Fraunhofer ISE, graphic: B. Burger, source: https://www.energy-charts.de
Comparison of the load from January to June in the years 2015 to 2020. The load includes electricity consumption and grid losses, but not the pumped electricity consumption and own consumption of conventional power plants.
Share of renewable energies in net electricity generation 2002 – 2020
Share of renewable energies in net electricity generation – © Fraunhofer ISE, Grafik: B. Burger, source: https://www.energy-charts.de
In Kontakt bleiben