Photovoltaik in Europa – Statistiken und Fakten
Sprachauswahl 📢
Veröffentlicht am: 6. November 2020 / Update vom: 9. November 2020 – Verfasser: Konrad Wolfenstein
Photovoltaik in Europa – Statistiken und Fakten / Photovoltaic in Europe – Statistics & Facts
Seit 2012 nimmt das Produktionsvolumen von Strom aus photovoltaischer Solarenergie in der Europäischen Union (EU) stetig zu. Im Jahr 2018 wurden 122.316 Gigawattstunden produziert, verglichen mit den 67.523 Gigawattstunden im Jahr 2012. Im Jahr 2018 hatte Deutschland mit 2,95 Gigawatt den höchsten Kapazitätszuwachs in ganz Europa. Bis 2023 wird für Deutschland ein geschätzter Kapazitätszuwachs von 6,1 Gigawatt erwartet.
Trotz des Anstiegs des Produktionsvolumens in Europa ging die Gesamtzahl der Arbeitsplätze in der Photovoltaikindustrie zwischen 2008 und 2016 zurück, insbesondere in Spanien. Die Prognosen zeigen jedoch eine Erholung der Beschäftigungszahlen bis 2021, die sich auf 174.682 Arbeitsplätze in Vollzeitäquivalenten (FTE) belaufen. Bis 2021 wird erwartet, dass die GVA der PV-Solarindustrie in der Europäischen Union auf 9,5 Milliarden Euro ansteigt.
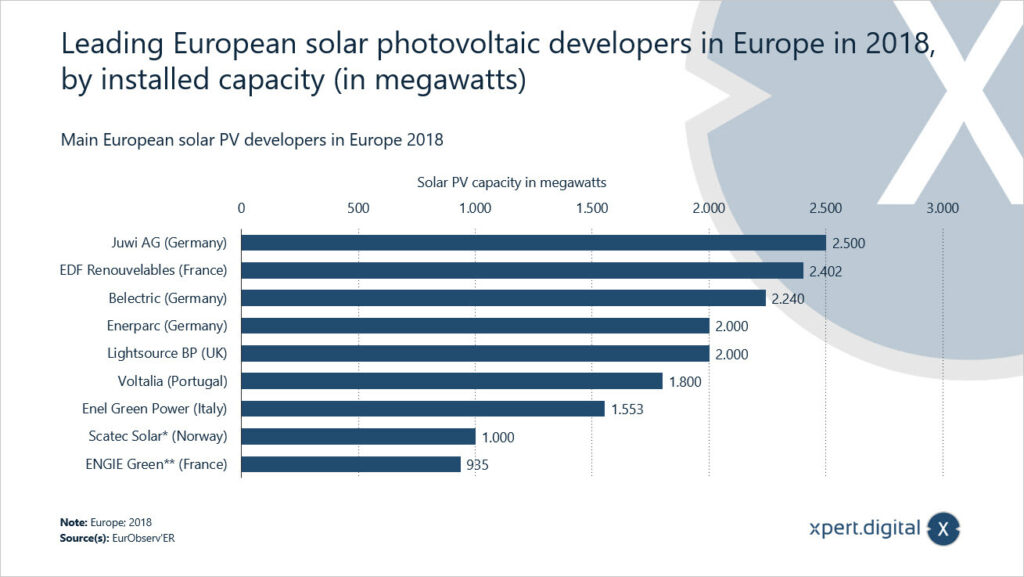
Hauptentwickler in Europa ist die in Deutschland ansässige Juwi AG mit einer installierten Leistung von mehr als 2.500 Megawatt.
2018 wurden in der Europäischen Union insgesamt 53,4 Millionen Quadratmeter solarthermische Flächen installiert. Im gleichen Jahr belief sich die Kapazität der installierten solarthermischen Flächen auf 1.546,1 Megawatt thermisch.
Deutschland ist das Land mit der höchsten installierten PV-Solarkapazität pro Einwohner in der Europäischen Union. Im Jahr 2018 meldete es 546,9 Watt pro Einwohner.
Since 2012, the production volume of electricity from solar photovoltaic power in the European Union (EU) has been steadily increasing. In 2018, 122,316 gigawatt-hours was produced, compared to the 67,523 gigawatt-hours recorded in 2012. In 2018, Germany had the highest capacity additions throughout Europe, amounting to 2.95 gigawatts. By 2023, Germany is projected to reach estimated capacity additions of 6.1 gigawatts.
Despite the increase in production volume in Europe, the overall number of jobs in the solar photovoltaic industry decreased between 2008 and 2016, especially in Spain. However, projections show a recovery in employment numbers by 2021, amounting to 174,682 FTE (full-time equivalent) jobs. By 2021, the GVA from the solar PV industry in the European Union is expected to increase to 9.5 billion euros.
The main developer in Europe is the German based Juwi AG, which had an installed capacity of more than 2,500 megawatts.
2018 saw a total of 53.4 million square meters of solar thermal surfaces installed in the European Union. In the same year, the capacity of installed solar thermal surfaces amounted to 1,546.1 megawatts thermal.
Germany is the country with the highest installed solar PV capacity per inhabitant in the European Union. In 2018, it reported 546.9 watts per inhabitant.
Führende europäische Solar-Photovoltaik-Entwickler in Europa im Jahr 2018, nach installierter Kapazität (in Megawatt)
Solar PV in Europe
Wichtiger Hinweis: Das PDF ist passwortgeschützt. Bitte nehmen Sie mit mir Kontakt auf. Selbstverständlich ist das PDF vergütungsfrei.
Important note: The PDF is password protected. Please contact me. Of course the PDF is free of charge.
Englische Version – Um das PDF zu sehen, bitte unten auf das Bild klicken.
English Version – To view the PDF, please click on the image below.
Passend dazu:
- Statistiken zum Thema Photovoltaik und Energiewende in Deutschland
- Weltweite Solar-Photovoltaik Industrie – Statistiken und Fakten
- Canadian Solar – Statistiken und Fakten
- First Solar – Statistiken und Fakten
- JinkoSolar – Statistiken und Fakten
- SolarCity – Statistiken und Fakten


