
Understand the USA better: a mosaic of the state states and EU countries in comparison-analysis of the economic structures-Image: Xpert.digital
Economic analogies: A comparative analysis of the economic structures of US states and EU nations
Introduction: the USA as a mosaic of economies
For European decision-makers from business and politics, a profound understanding of the US economy is of crucial strategic importance. However, a widespread fallacy is to consider the United States as a single, homogeneous economic unit. This perspective fails to recognize the fundamental reality: the United States is a federation of 50 different, often competing and complementary economic areas, each of which has their own strengths, specializations and regulatory framework. The real economic and dynamics of the United States only reveal itself at an analysis at the level of the individual states. Some of these states have gross domestic products (GDP) that exceed the significant nation states and actively act as an independent global economic powers.
This article pursues the goal of deciphering this complexity for a European audience. The methodology deliberately goes beyond a purely comparison of the GDP numbers. Instead, a multidimensional, comparative analysis is carried out, which takes the following aspects into account:
- Sectoral composition of GDP: The relative importance of services, industry and agriculture.
- Specialization in key industries: concentration on sectors such as technology, energy, finance or advanced production.
- Structure of the industrial basis: the ratio of large global corporations to a robust medium -sized company.
- Logistical infrastructure and trade orientation: the role as a trading circuit, the quality of the ports, airports and country transport.
- Regulatory and tax framework: The specific political and legal factors that shape the business climate.
The illusion of a direct one-to-one language is avoided. It is rare that a US state represents an exact reflection of a single EU country. Rather, the states are analyzed as an economic hybrid that can combine characteristics of several European nations. California, for example, combines the technological innovative strength and industrial scale of Germany with excellence in the agricultural and wine production of France and the global dominance of the cultural and entertainment industry, which is reminiscent of Italy. Texas, in turn, reflects the role of the Netherlands as an energy and logistics hub, but also shows parallels to the industrial rise of Poland as an attractive investment location.
This multi-perspective approach is intended to draw a nuanced and strategically usable image of the US economic landscape. Understanding these subnational ecosystems is the key to precisely identifying the opportunities and challenges the American market offers and developing effective strategies for investments, expansion and political cooperation.
The global giants - California and Texas in the European mirror
At the top of the US economy are two states, which in their sheer size and their global influence put entire continents in the shade: California and Texas. Together they generate almost a quarter of the entire US BIP and embody two different, but equally powerful models of American capitalism. Your analysis compared to European counterparts reveals fundamental structural similarities and profound differences that are essential for understanding global economic architecture.
California: A nation within a nation
With a gross domestic product of $ 4.1 trillion in 2024, California would be the fourth largest economy in the world and would follow nations such as Germany and Japan. This number alone makes it clear that the “Golden State” is not just a state, but a global economic and cultural divider. Its economic structure is highly developed, post-industrial and strongly service-oriented.
Economic profile and sectoral composition
The California economy is dominated by a few but extremely powerful sectors. At the top are finances and real estate that form a stable basis on GDP with a share of 18%. However, the sectors of professional and business services (16%) and the information sector (14%) are far more dynamic and formative for global perception. These are largely driven by the technology and entertainment industry and are the main sources for the impressive growth of the state.
Although the proportion of the manufacturing trade on GDP appears relatively low at 11%, this is a misleading key figure. In absolute numbers, this means an industrial added value of over $ 400 billion, which exceeds the industrial production of many industrialized nations. This production is highly technological and closely linked to the state's innovation clusters.
Industrial and cultural cluster: The three pillars of power
California's unique economic power is based on the concentration of three leading clusters worldwide:
Technology (Silicon Valley)
As an undisputed epicenter of the global digital economy, the Silicon Valley is more than just an industrial cluster; It is an ecosystem that produces innovations at a pace that challenges the rest of the world. Companies such as Apple, Google (Alphabet), Meta and countless start-ups define the future of software, artificial intelligence, biotechnology and digital platforms here. This sector is the primary engine behind the GDP contributions of the “professional and business services” and the “information sector”.
Entertainment (Hollywood)
The film and entertainment industry with center in Los Angeles is another pillar of California dominance. It is not only a direct economic factor that, according to estimates, takes over $ 30 billion to California and supports over 200,000 jobs directly, but also a source of immense “Soft Power”. Hollywood shapes global culture, sets trends and is a huge tourism magnet. State incentives, such as $ 750 million annually than doubled film and television tax credit program, cement this position. 16 recently funded television projects alone are to generate economic output of $ 1.1 billion.
Agriculture (Central Valley)
Often standing in the shadow of tech and entertainment, California agriculture is a global giant in itself. With an annual turnover of around $ 59 billion, the state is a power center of food production. It delivers over a third of the vegetables grown in the USA and three quarters of the fruits and nuts. For certain products such as almonds, California holds a de facto monopoly and delivers 100% of the commercial harvest of the United States and 80% of world production. However, this amazing productivity has a high price: the agricultural sector consumes about 40% of the total available water in the state, which makes it extremely amazed in the face of climate change and recurring droughts.
Comparative analysis with the EU
California cannot be covered by comparison with a single EU country. It is a hybrid that combines the characteristics of several European heavyweights:
Vs. Germany
The analogy to Germany lies in sheer economic strength, technological leadership role and global export orientation. Both are power centers of innovation. The focus is on the decisive difference: While the German strength traditionally comes from the optimization of the physical world - automotive construction, mechanical engineering and the chemical industry - California draws its strength from disruption and mastery of the digital world, i.e. software, platforms and data -controlled business models.
vs. France
The parallel to France is striking when you look at the combination of a highly productive, intensive agriculture and a globally influential cultural industry. The California Central Valley with its wine and specialty production is the American counterpart to the French wine regions. At the same time, Hollywood with its global range reflects the cultural and economic importance of the French luxury goods and tourism industry.
vs. Italy
Similarities to Italy can be found in the strong regional specialization of industrial clusters. As the Silicon Valley stands for technology, northern Italian regions for mechanical engineering, fashion or design are known. Both economies are characterized by a strong emphasis on the design, brand and high -quality consumer goods.
Comparative economic profile: California vs. Germany & France
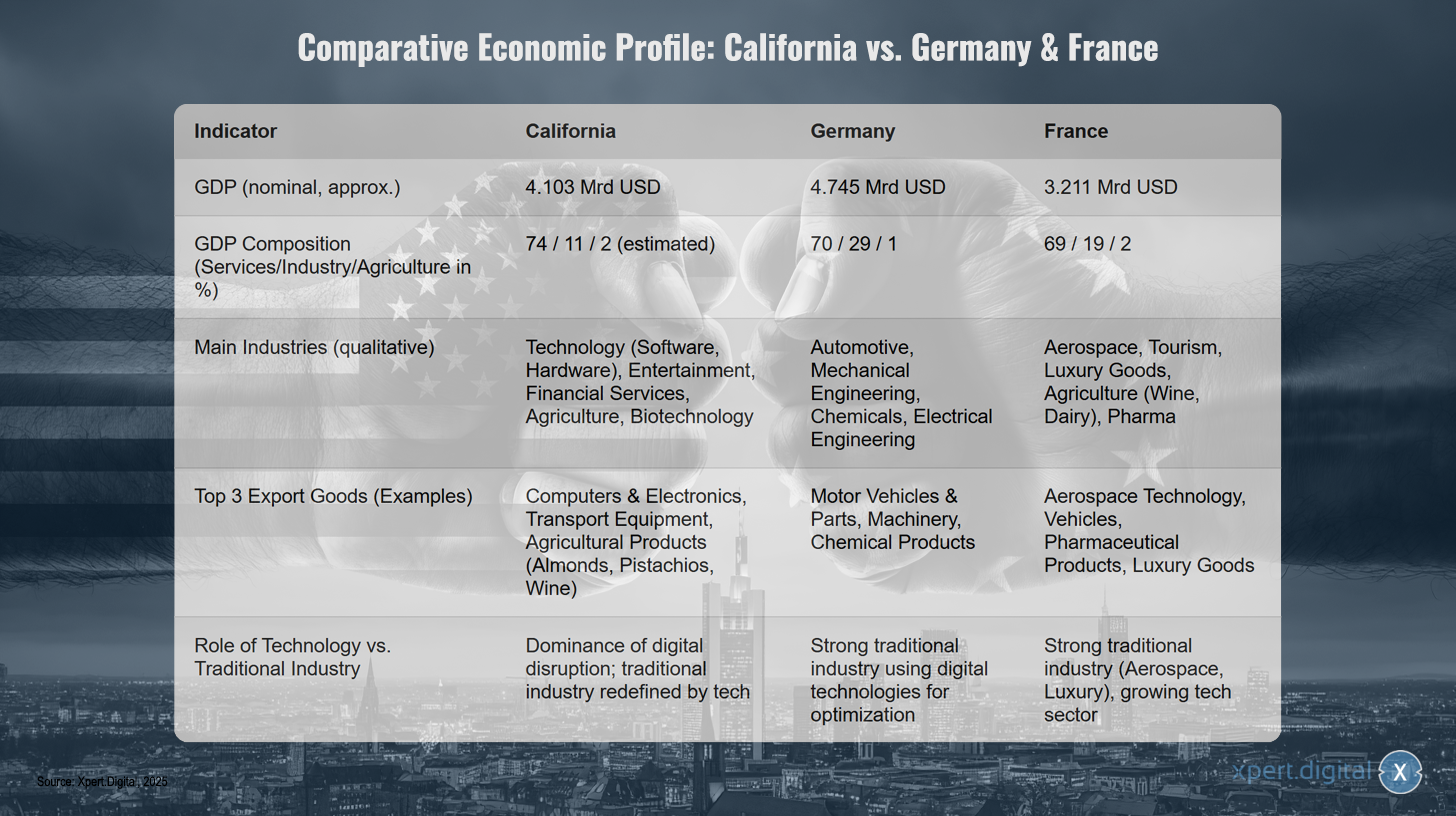
Comparative economic profile: California vs. Germany & France - Image: Xpert.digital
The comparative economic profile between California, Germany and France shows significant differences in the economic structure and orientation of the three regions. At around $ 4,103 billion, California has a nominal gross domestic product that lies between the German GDP of $ 4,745 billion and the French of $ 3,211 billion.
California's economic structure is strongly service -oriented, with the service sector estimated to be an estimated 74 percent of GDP, while industry and agriculture have significantly lower shares with 11 or 2 percent. Germany shows a more balanced structure with 70 percent services, but a significantly higher industrial share of 29 percent and an agricultural share of 1 percent. France has a distribution similar to Germany, with 69 percent services, 19 percent industry and 2 percent agriculture.
In the main industries, technology in California dominate technology in the form of software and hardware, entertainment, financial services, agriculture and biotechnology. Germany focuses on traditional branches of industry such as automotive construction, mechanical engineering, chemistry and electrical engineering. France, on the other hand, is characterized by aerospace, tourism, luxury goods, agriculture with a focus on wine and dairy products as well as the pharmaceutical industry.
The export structure reflects these industrial focuses. California mainly exports computers and electronics, transport equipment and agricultural products such as almonds, pistachios and wine. Germany leads to motor vehicles and parts, machines and chemical products. France focuses on air and space technology, vehicles, pharmaceutical products and luxury goods.
The different approaches to technology versus traditional industry are particularly striking. California is dominated by digital disruption, with traditional industries being redefined by technology. Germany has a strong traditional industrial nose that uses digital technologies to optimize. France combines a strong traditional industry in areas such as aviation and luxury goods with a growing technology sector.
Findings and strategic implications
The analysis of the California economy reveals two crucial knowledge for European actors.
First, the “scale trap” of perception. A sector like agriculture, which, with around 2%, only makes up a small part of California GDP, is often underestimated in its global meaning. However, the absolute value of this sector, which amounts to USD 50 to 80 billion, far exceeds the entire agricultural production of many EU nations. For comparison: the entire Greek agriculture generates a GDP of around $ 16 billion. This means that even a niche sector in California can be a global market leader. European companies and political decision -makers must therefore not confuse percentage shares with absolute market size and power.
Second, the symbiosis and competition with Europe. California's economic model is both a threat and a chance for Europe. The tech industry directly challenges traditional European industries such as the automotive sector, as the rise of Tesla shows, while German manufacturers lose market shares. At the same time, precisely these European companies are dependent on California software, cloud infrastructure and AI research in order to remain competitive. The French luxury and cultural industry also competes for global attention and budgets with Hollywood, but also uses California social media platforms as an indispensable marketing channels. A purely confrontational or purely cooperative strategy towards California is therefore doomed to fail. European actors have to develop a hybrid strategy of “co-opetition”-a mixture of cooperation and competition-to survive in this complex environment.
Texas: The energy and trade center
Texas, the “Lone Star State”, represents another but no less impressive American economic model. With a GDP of $ 2.7 trillion, it is the second largest economy in the United States and would be the world's eighth largest as an independent nation, still in front of countries such as Canada, Russia or Italy. While California draws its strength from the digital and cultural sphere, Texas power is based on control over physical resources and trade currents.
Economic profile and sectoral composition
The Texas economy traditionally relies on the huge occurrence of oil and natural gas that have made the state into a global energy center. The export of oil and gas alone was $ 140 billion in 2023, supplemented by $ 70 billion from refined oil and coal products. The processing industry is closely linked to this, which is a cornerstone with a contribution of $ 241 billion to GDP (around 13% of the overall economy). This sector is dominated by the petrochemical industry, but the production of computers and electronic parts is also of enormous importance with exports worth $ 53 billion.
In recent years, Texas has advanced a remarkable diversification. The economy is increasingly expanding into areas such as information technology, aerospace, defense, biomedical research and renewable energies, especially wind power.
Infrastructure, trade and regulatory environment
Texas is the undisputed export master of the United States. With exports worth over $ 440 billion in 2023, the state exports more than the two next placed states. This dominance is made possible by a first -class logistical infrastructure. The port of Houston is the largest US harbor after the tonnage, and the Dallas/Fort Worth International Airport is classified as one of the best air freight ports in the world. The geographical location makes Texas a natural goal for trading in Latin America, with Mexico being the largest trading partner by far.
A crucial factor for Texas' economic success is his regulatory environment. The state does not raise income tax for private individuals and maintains a very company -friendly climate with low regulatory density. This has made Texas a magnet for business relocations from other states and for new start-ups, which is reflected in the highest number of Fortune 500 corporate centers in the USA.
Comparative analysis with the EU
Vs. Netherlands
This is the most appropriate European analogy. Both act as central energy and logistics hubs for their respective economic areas. Just as Texas supplies the US energy market with oil and gas and handled world trade over the port of Houston, the Netherlands were historically the Gashub in Europe and are the most important goal for European trade with the port of Rotterdam, the largest of the continent. Both economies are extremely open and dependent on global trade. The Dutch trade rate (exports plus imports in relation to GDP) of 166% underlines this extreme specialization in trade and logistics, a feature that also characterizes the Texas economy.
vs. Poland
There are structural parallels with regard to the promotion as an attractive location for foreign direct investments (FDI) in the production sector. Similar to Texas, Poland attracted companies from more expensive and more regulated regions through a cheap business climate, a large and qualified workforce and a strategic situation within its economic area (the EU). Both are experiencing dynamic economic growth, which is to a considerable part of success to be a competitive production location.
Findings and strategic implications
The analysis of the Texas economy provides two basic insights for the European strategy.
First, energy as a geopolitical tool and economic advantage. The dominance of Texas in oil and gas production has helped the USA to achieve relative energy independence and to develop into a net exporter of energy. This is in a sharp contrast to the situation of many EU countries, especially Germany, whose economies and geopolitical ability to act strongly depend on energy imports. The resulting lower energy costs in Texas are a significant competitive advantage. For European energy -intensive industries (e.g. chemistry, steel), Texas is therefore not only a sales market, but is increasingly also a potential production location in order to secure yourself against geopolitical energy risks and benefit from cost advantages.
Second, the “low-tax, low-regulation” model as a direct challenge for the European social model. The immense success of Texas in the recruitment of companies and capital is based on an economic model that is diametrically opposed by the European approach. While EU countries such as Germany and France finance their comprehensive social systems through high taxes and dense regulation, Texas offers the opposite. Depending on investments and corporate headquarters from Europe or other US states to Texas is a microcosm of global competition for economic systems. This represents a fundamental threat to the financing base of the European Social State. European political and economic leaders are faced with the challenge of finding ways to maintain competitiveness without giving up the social and ecological standards that define their companies.
🎯🎯🎯 Benefit from Xpert.Digital's extensive, five-fold expertise in a comprehensive service package | BD, R&D, XR, PR & Digital Visibility Optimization

Benefit from Xpert.Digital's extensive, fivefold expertise in a comprehensive service package | R&D, XR, PR & Digital Visibility Optimization - Image: Xpert.Digital
Xpert.Digital has in-depth knowledge of various industries. This allows us to develop tailor-made strategies that are tailored precisely to the requirements and challenges of your specific market segment. By continually analyzing market trends and following industry developments, we can act with foresight and offer innovative solutions. Through the combination of experience and knowledge, we generate added value and give our customers a decisive competitive advantage.
More about it here:
From the heavy industry to high -tech: America's structural change as a model for Europe?
Financial and service centers- New York and Florida
While California and Texas draw their global importance from technology, energy and trade, the economies of New York and Florida are based on other but also powerful columns: the concentration of global capital and the attraction of people and services. They represent the spearhead of the American service economy and, compared to Europe, offer revealing insights into the functioning of financial markets and demographic power growth.
New York: Global financial capital
With a GDP of almost 2.3 trillion USD, the state of New York is the third largest economy in the United States and in itself one of the largest in the world. The economy is overwhelming by the New York City metropolitan region and in particular by Manhattan, which is considered the undisputed global center for banks, finance and communication.
Economic profile and sectoral composition
The economic structure of New York is a prime example of a highly developed service economy. The financial and insurance sector is by far the most important industry. It alone contributes over $ 315 billion to GDP in the state, which corresponds to a share of around 29% of the total economic output. This sector does not employ the most people, but generates the highest added value. This is followed by further massive service sectors: real estate and leasing with almost 250 billion USD, the information sector with $ 195 billion, professional and technical services with $ 176 billion and the healthcare system with $ 149 billion. With a contribution of around 70 billion USD, the processing industry plays a subordinate but still substantial role.
Structural duality: NYC vs. Upstate
The economy of the state is characterized by a remarkable duality. On the one hand, the globalized, hyper-dynamic and extremely service-intensive economy of New York City is located. On the other hand, the rest of the state is often referred to as “upstate New York”. These regions are economically stronger from traditional industry, agriculture (especially dairy products, apples and wine growing in the fingers of Lakes) and recently shaped by investments in renewable energies such as solar and wind power. This division of two leads to different economic realities and political priorities within the same state.
Comparative analysis with the EU
Vs. Ireland / Luxembourg
The most obvious European analogy for New York's economic model can be found in the financial centers Ireland and Luxembourg. All three have geared their economies extremely to the financial sector as a central engine. However, the decisive difference lies in the source of their attraction. While Ireland and Luxembourg, as European financial hubs, largely rely on extremely advantageous tax framework conditions for multinational corporations, New York's dominance is based on the sheer size, depth and liquidity of its capital markets. The New York Stock Exchange (NYSE) and NASDAQ are the two largest stock exchanges in the world, both after market capitalization and for commercial activity. The scale is incomparable: the finance and insurance sector of New York alone ($ 315 billion) generates almost as much as the entire gross domestic product of Ireland.
Vs. Germany (Frankfurt) / France (Paris)
Although Frankfurt and Paris are important continental finance centers, they act within a polyentric European financial system. None of the two centers have the singular, global supremacy that New York City has. Wall Street is not just an American, but the global financial center, which is manifested in the investment banking fees of around $ 55 billion in 2018.
Findings and strategic implications
The analysis of the New York economy leads to a central knowledge: concentration of capital as a global power factor. The unprecedented concentration of capital, financial institutions and specialized services in New York City gives the United States enormous, often underestimated control over global financial flows. Decisions on capital allocation, risk assessment, corporate reviews and the development of new financial products that are made on Wall Street have direct and immediate effects on European companies, investors and markets. European companies are not only customers of the New York financial system, they are also subject to their cycles, rules and sentiments. For Europe, this results in the strategic need to deepen and strengthen your own capital market union. Only by creating a sufficiently large, liquid and integrated European capital market can this structural dependence on a single non -European financial center reduced in the long term.
Florida: tourism, trade and demographic change
Florida, the “Sunshine State”, has developed into the fourth largest economy in the United States with a GDP of over 1.7 trillion. His economic model is based on an attractive mix of services, trade and an unstoppable population growth, which acts as a primary economic engine.
Economic profile and sectoral composition
Florida's economy is carried by several strong columns. The largest sectors are real estate and leasing (USD 265.5 billion), professional and business services (USD 208.3 billion) and health and social affairs (USD 126.2 billion). However, tourism plays an outstanding and formative role. In 2023, this sector directly and indirectly contributed $ 127.7 billion to the state's economic output and supported over 2.1 million jobs, which corresponds to 14% of the total non-agricultural employment. The spending of the visitors achieved a record of USD 131 billion.
Other important industry is international trade and banking. Miami in particular has established itself as a “gateway to Latin America” and houses the greatest concentration of international banks in the United States, which makes the state an important financial and trade center for the western hemisphere. Agriculture, in particular the cultivation of citrus fruits and vegetables, also remains an important economic factor.
Growth driver: The Demography factor
One of the most fundamental drivers of the Floridian economic miracle is the strong and constant population growth. Unlike in many other regions of the western world, this growth is driven almost exclusively by immigration-both from other US states and from abroad. This constant influx of new residents, employees and pensioners fueled dynamic internal demand, especially in the construction and real estate sector, in retail and healthcare.
Comparative analysis with the EU
Vs. Spain / Greece
The strongest analogy for Florida can be found in the large tourism nations of southern Europe. The outstanding importance of tourism for the overall economy is a common feature and a shared vulnerability. In Spain, tourism contributed around 15.6% to GDP in 2024. In Greece the direct contribution was 13%, but the indirect and induced contribution is estimated at up to 33.7% of GDP. Similar to Florida, these economies are strongly dependent on external shocks (such as pandemics, economic crises or geopolitical uncertainties) that affect international travel. All three benefit from a warm climate, extensive coastal lines and a highly developed tourist infrastructure.
Vs. Cyprus / Malta
Smaller EU island states have parallels to Florida's role as an attraction for international capital, wealthy pensioners and service-oriented companies. They lure with a pleasant lifestyle, a cheap climate and often also with advantageous tax framework, which makes them popular destinations for a clientele similar to Florida.
Findings and strategic implications
Florida's analysis illustrates a decisive structural dynamic: demography as a primary economic engine. While many European countries and also some traditional industrialized countries in American “Rust Belt” are confronted with the challenges of a stagnating or shrinking population, Florida's economic growth is inextricably linked to its population growth. This process of “internal migration” within a large, integrated economic area such as the United States acts as a strong and self -increasing economic engine. New residents need living space, consume goods and services and reasons, which in turn creates jobs and attracts other people.
For Europe, where the linguistic, cultural and administrative hurdles for internal European migration are higher and the mobility between the Member States is comparatively lower, this represents a structural disadvantage. Florida is a case study of how an attractive climate and a favorable business environment in a large internal market can unleash a demographic dynamic that leads to sustainable economic growth. Investors who invest in Florida therefore implicitly rely on the continuation of this fundamental demographic trend.
The industrial heart of America - the “Rust Belt” in change
The region known as “Rust Belt” in the northeast and middle west of the United States was once the undisputed industrial center of the world. Characterized by coal, steel and mass production, this region has undergone a profound and often painful structural change. States such as Illinois, Pennsylvania, Michigan and Ohio are far from being mere relics of a past era. They have changed to highly diversified and technologically advanced industrial locations, whose economic structures and challenges have remarkable parallels to the industrial core countries of Europe.
Illinois & Pennsylvania: Diversified industrial powers in structural change
Illinois and Pennsylvania embody the successful, if not yet completed, transition from the old heavy industry to a modern, knowledge -based economy. Today they are diversified strength centers that have preserved their industrial basis and at the same time have developed new strengths in services and technology.
Economic profile Illinois
With a GDP of over 1.1 trillion USD, Illinois is the fifth largest economy in the United States. The economy is greatly diversified and is dominated by the chicago metropolitan region, which is not just a regional, but a global financial center and the world's largest appointment exchange, the Chicago Mercantile Exchange. In addition to the financial sector, the most important pillars of the economy are the manufacturing business, agriculture and a wide range of company services. The industry, which includes sectors such as mechanical engineering, food processing and chemical products, remains a central pillar and contributes around $ 137 billion to GDP alone. Outside of Chicagos, the “Corn Belt” shapes the landscape, with corn and soybeans being the most important agricultural products.
Economic profile Pennsylvania
Pennsylvania's economy, with a GDP of around 1.0 trillion USD the sixth largest in the United States, is a mosaic of modern and traditional sectors. The biggest drivers are today the healthcare system, the real estate and leasing sector as well as the manufacturing business. The latter remains an economic cornerstone with a contribution of over 113 billion USD (approx. 13% of GDP) and more than 562,000 jobs. Historically, the name Pennsylvania was synonymous with steel. Even if the dominance of the steel industry is broken, it remains an important factor with a direct value added contribution of $ 8.5 billion. However, the industrial basis has widened significantly and today also includes chemical products, food processing and advanced mechanical engineering.
Comparative analysis with the EU
vs. Germany (especially North Rhine-Westphalia)
The analogy between the American “Rust Belt” and the German Ruhr area is particularly apt. Both regions were the heart chambers of the industrial revolution of their nations, based on coal and steel. Both have undergone a profound structural change from the heavy industry to a diversified economic landscape, which today comprises strong service, technology and logistics components. Metropolises such as Chicago and the Rhein-Ruhr area (Düsseldorf, Cologne) act as highly developed service and financial centers for their industrial hinterland. Both regions struggle with the demographic and ecological heritage of their industrial past, but have an immense industrial residual substance, a dense infrastructure and highly qualified workers. One difference remains the higher industrial density in Germany, where the manufacturing trade is around 18.5% of national GDP, compared to around 12-14% in Illinois and Pennsylvania.
vs. Italy (especially Lombardy)
Another parallel can be found compared to northern Italy. The combination of a strong financial center (Chicago or Milan) and a wide -ranging industrial area is a common feature. The Italian industry is known for its clusters of highly specialized small and medium -sized companies (SMEs), which has similarities with the diversified and often medium -sized manufacturing landscape in Pennsylvania and Illinois, which differs from the states dominated by large corporations such as Michigan.
Findings and strategic implications
The analysis of these states reveals a crucial development path: the path from de industrialization to re-industrialization. Illinois and Pennsylvania impressively demonstrate that the decline of the traditional heavy industry does not have to mean the end of industrial importance. Successful change towards advanced production (“Advanced Manufacturing”), medical technology, logistics and industrial services is a model that is also of great relevance for many European alt an industrial regions. The process shows that industrial strength can be preserved if the focus is relocated from the mass production of raw materials to the production of highly complex, knowledge -intensive goods. For European investors, this means that these states are not “rusting” relics, but markets in an advanced phase of economic transformation. The greatest opportunities are no longer in the old heavy industry itself, but in the technologies and services that enable and advance this change - this includes automation, industrial software, advanced materials and specialized logistics solutions.
Michigan & Ohio: The automotive axis and its transformation
Michigan and Ohio form the historical and current center of the North American automotive industry. Their economies are shaped by this one sector that is only comparable to the automotive nucleus in Europe. Today they are at the center of the greatest transformation in their history: the transition to electromobility and autonomous driving.
Economic profile Michigan
Michigan's economy, with a GDP of around $ 719 billion, is inextricably linked to the automotive industry. The sector is not just part of the economy, it is its DNA. It is estimated that the automotive industry directly and indirectly contributes to the economic output of the state directly and indirectly. The three major US automobile manufacturers-General Motors, Ford and Stellantis (formerly Chrysler)-have their global headquarters here. The processing industry is the largest sector after employment and, with $ 99 billion, contributes significantly to GDP. It is crucial that Michigan is not only a workbench, but also the brain of the US car industry: the state is the leading center for research and development (F&E) in the automotive sector of the USA.
Economic profile Ohio
Ohios economy (GDP: 928 billion USD) is also strongly industrial and closely connected to the automotive axis. The manufacturing trade is the largest individual economic sector and contributes to almost a fifth of the state GDP. Within this sector, the production of motor vehicles and parts is one of the main activities, which makes Ohio an indispensable part of the North American automotive supply chain.
Comparative analysis with the EU
Vs. Germany (especially Baden-Württemberg/Bavaria)
This is the most direct and strongest analogy in the entire report. The economic areas Michigan/Ohio and southern Germany are global twin clusters of the automotive industry. Both are characterized by the presence of world -famous original equipment manufacturers (OEMS) and an extremely dense, highly specialized network of suppliers. Both are leaders in the automotive F&E and face the absolutely identical, existential challenge of transformation from the combustion engine to electromobility and to autonomous driving. The importance of the sector is comparable: In Germany, the automotive industry contributes around 5% to national GDP, which underlines its immense economic role.
Vs. Czech Republic / Slovakia
These countries can be considered as the “workbenches” of the European automotive industry. Their economies are to an extreme extent to automotive production for foreign, mostly German corporations. This reflects the dependency structure of many suppliers to Michigan and Ohio from the decisions of the “Big Three” in Detroit. Czech industry, for example, accounts for 37% of GDP, with the automotive industry being by far the largest and most important partial sector.
Findings and strategic implications
The analysis of this automobile cluster leads to a profound knowledge: a shared fate in global transformation. The future of the Michigan/Ohio economic areas on the one hand and southern Germany/Czech Republic on the other hand depends on the answer to the same question: Who will win the technological race for the future of mobility? Success or failure in one of these clusters will have direct and inevitable effects on the other. The rise of new competitors such as Tesla in the USA or Chinese manufacturer in Europe threatens the established actors alike in both regions.
However, this is not a pure competitive situation, but a global race with distributed fronts and complex interdependencies. A breakthrough in battery technology in Michigan could have been developed by a German supplier. Failing the German OEMs in the development of competitive software for their vehicles could pave the way for tech companies from the USA, which then become indispensable partners or overpowering competitors. For European investors and companies, this means that a strategy that only rely on one region is risky. Instead, you have to rely on the technological winners along the entire global value chain, regardless of your geographical origin. The cooperation across the Atlantic, for example between German mechanical engineers and American software start-ups, is not a sign of weakness, but a strategic need to survive in this global transformation struggle.
Our recommendation: 🌍 Limitless reach 🔗 Networked 🌐 Multilingual 💪 Strong sales: 💡 Authentic with strategy 🚀 Innovation meets 🧠 Intuition


From local to global: SMEs conquer the global market with clever strategies - Image: Xpert.Digital
At a time when a company's digital presence determines its success, the challenge is how to make this presence authentic, individual and far-reaching. Xpert.Digital offers an innovative solution that positions itself as an intersection between an industry hub, a blog and a brand ambassador. It combines the advantages of communication and sales channels in a single platform and enables publication in 18 different languages. The cooperation with partner portals and the possibility of publishing articles on Google News and a press distribution list with around 8,000 journalists and readers maximize the reach and visibility of the content. This represents an essential factor in external sales & marketing (SMarketing).
More about it here:
Why European investors have an eye on the wrong American states
Agriculture and specialized production - the middle west & the northwest of the Pacific
Apart from the global financial, tech and industrial centers, there are economic areas, the strength of which is based on a deep specialization in agricultural economy or a unique combination of high technology and traditional industry. The states of the middle West such as Iowa and Nebraska form the grain chamber of America and a center of food finishing, while the state of Washington in the northwest of the northwest is a fascinating dual power center of software and aviation.
Iowa & Nebraska: The grain chamber and its refinement
Iowa and Nebraska are the heart of the American “Corn Belt”. Their economies are a prime example of a highly efficient, industrialized agriculture that goes far beyond pure original production and extends deeply into the processing industry and the financial sector.
Economic profile Iowa
Iowa's economy (GDP: USD 261 billion) is fundamentally shaped by agriculture and the associated industries. Although agriculture itself “only” contributes to direct GDP, its indirect effect is enormous: together with the upstream and downstream sectors, the agricultural economy generates over 22% of the state's total economic output and provides almost every fifth workplace. The largest single sector according to GDP contribution is the manufacturing trade with 17.2%, which largely consists of food processing, the production of agricultural machinery and agricultural chemicals. Iowa is one of the leading US producers of corn, soybeans, pork and eggs and a center of ethanol production.
Economic profile Nebraska
Nebraska's economy (GDP: 141 billion USD) follows a similar pattern. Agriculture is the dominant economic factor and places more than 40% of jobs in over half of the 93 counties. The most important agricultural products are beef, corn and soybeans. Interestingly, however, as in Iowa, agriculture itself is not the largest GDP coach, but the finance and insurance sector with $ 19.3 billion, closely followed by the manufacturing business with $ 17.8 billion.
Comparative analysis with the EU
vs. France (agricultural sector)
France is considered the agriculture of the European Union, similar to the middle west for the USA. Both regions produce huge amounts of staple foods such as grain and have strong animal husbandry. However, a significant difference is the relative importance for the overall economy: While agriculture in Iowa and Nebraska forms the foundation of the entire economic structure, the French agricultural sector contributes to national GDP with only 1.9%, which underlines the much stronger diversification of the French overall economy. The absolute production value of French agriculture was 95.5 billion euros in 2023, which illustrates the size.
Vs. Denmark
There is an apt analogy to Denmark. Both economic areas combine a highly efficient, technology-driven and export-oriented agriculture (especially in pig production) with a strong industry for agricultural technology, food processing and agricultural biotechnology.
Findings and strategic implications
The analysis of Iowa and Nebraska reveals an often overlooked but decisive economic structure: the invisible interweaving of primary and tertiary sectors. At first glance, it seems paradoxical that the financial and insurance sector is one of the leading GDP contributions in these agricultural states. However, this is not a sign of a diversification away from agriculture, but on the contrary a symptom of its extreme modernization and complexity.
Modern, industrialized agriculture is a highly capital -intensive and risky business. It requires specialized financial products for the protection of crop failures (harvest insurance), the volatility of raw material prices (goods mining exchanges such as in chicago), the financing of expensive agricultural machinery equipment and investing in biotechnology. The strong financial and insurance clusters that have developed in cities such as the Moines (Iowa) and Omaha (Nebraska) are a direct answer to this need. Their strength is inextricably linked to the strength and capital requirement of the agricultural sector. For European actors, this means that engagement in these countries requires a deep understanding of the entire agricultural value chain - from seeds to harvesting and processing to financing and insurance.
Washington: A dual power center from technology and traditional industry
The state of Washington (GDP: 847 billion USD) on the Pacific coast is a fascinating economic hybrid that combines two apparently opposing worlds: the digital future and the traditional heavy industry.
Economic profile
Washington's economy is dominated by two global giants from two different epochs. On the one hand are the tech companies of the Seattle metropolitan region, especially Microsoft and Amazon. They are the driving force behind the strong information sector and professional services and make Washington one of the world's leading centers for software development, cloud computing and e-commerce. On the other hand, the legacy of the industrial aerospace is embodied by Boeing. Although the company has to deal with challenges, the region remains a global center for aircraft production and the associated highly specialized supply chain. This dual structure is complemented by important sectors such as agriculture (apples, wine), forestry and one of the most important ports on the US west coast (Port of Seattle/Tacoma), which is a crucial goal for the trade in Asia.
Comparative analysis with the EU
Vs. Ireland
The strongest European parallel to Washington Tech sector can be found in Ireland. The Irish economy is determined to an exceptional extent by a handful of large, global technology groups from the USA that entertain its European headquarters there. The technology sector contributes around 13% to GDP in Ireland and makes the country extremely export -oriented. In their economic development and stability, both Washington and Ireland depend heavily on the global strategies and the success of these few multinational groups. This creates enormous growth and highly qualified jobs, but also a significant structural dependency.
vs. Finland
Finland offers another interesting analogy. Similar to Washington, Finland combines a strong, internationally oriented technology and ICT industry (historically shaped by Nokia) with traditionally important, resource-based industries such as the forestry and paper industry. Both economies have proven that they can build world-class competencies in both digital and physical goods production.
The economy of the state of Washington shows how a region can also be leading at the head of the digital revolution and in a traditional, capital -intensive industry. This dual strength makes the economy resistant, but also creates complex dependencies and requires a policy that can balance the needs of very different sectors.
Synthesis and strategic conclusions for European actors
The detailed analysis of the individual US states and their European counterparts draws the image of a US economy, which is far more complex, diverse and more dynamic than it can be assumed. Instead of a monolithic block, a mosaic of highly specialized, partly competing, partly complementary economic areas is revealed. For European companies, investors and political decision -makers, there are decisive strategic conclusions from this granular perspective.
Summary of the analogies and divergences
The comparison has shown that the US economy is characterized by three main features:
- Extreme scaling: States such as California and Texas act with their trillion dollar people on a scale that exceeds most nation states. Even their “niche sectors” can put the overall economy of smaller EU countries in the shade.
- Deep specialization: states such as Michigan (automobile), Iowa (agricultural economy) or New York (finances) have an extreme concentration in certain industries, which leads to deep value chains and highly specialized ecosystems.
- High dynamics: driven by factors such as demographic growth (Florida) or a company-friendly regulatory environment (Texas), many US states show growth dynamics that are less common in the more mature economies in Europe.
In comparison, the economy of the European Union is similarly large in its entirety, but is structurally structured differently. It is more poly -centered, more fragmented by national borders, comprehensively regulated and shaped by welfare -state models. Their strength lies less in the disruptive power of individual giants than in the excellence of highly specialized, often medium -sized niches, such as German mechanical engineering, the northern Italian production or the French luxury goods industry.
Identification of overarching trends and their implications
The analysis can be derived from three overarching trends that define the relationship between the US and the European economy:
- Regulatory arbitrage and internal competition: Within the USA, companies can choose locations based on very different regulatory and tax framework. A company can use the high talent density and innovative strength of California and at the same time shift production facilities to tax -priced Texas. This intensive internal competition of the locations is a form of the “regulatory arbitrage” that does not exist in the EU due to the more harmonized, if not identical, framework conditions and the lower mobility of companies and workers in this form. This provides the US economy as a whole a greater flexibility and adaptability.
- Energy independence versatility versatility: The fundamental contrast between energy -friendly countries such as Texas and industrialized industries such as Germany depends heavily on energy imports is a crucial strategic difference. The availability of favorable and abundant energy in parts of the United States is not only a cost factor, but also a geopolitical advantage that increasingly influences investment decisions. For European companies in energy -intensive industries, the relocation of production capacities to the USA becomes a strategic option for risk minimization.
- Technological disruption and dependency: The concentration of global digital disruption in a few US states, especially California and Washington, is a systemic challenge for the traditional industries of Europe. Whether in automotive construction, mechanical engineering or in the media sector-European companies are confronted with a double reality: they compete with the new digital giants and are at the same time Platforms, software and infrastructure dependent. This “co-opetition” requires complex strategies that go beyond simple partnership or competitive models.
Strategic recommendations
Based on these findings, specific strategic recommendations for European actors can be derived:
- For investors: Instead of investing “in the USA”, portfolios should build on a granular, states -based analysis. An investment in the established German automotive supply industry could be diversified and secured, for example, by a targeted investment in the aspiring ecosystem for electromobility and battery technology in Michigan or in the “Auto-Belt” of the south. An engagement in the European luxury goods sector could be supplemented by investments in the California entertainment and media industry, which also determines the global trends and sales channels.
- For companies: Location decisions in the United States have to be based on a profound analysis of state and regional ecosystems. A logistics company will evaluate the framework conditions in Texas, Illinois or Ohio differently than a biotech company, for which the proximity to the research clusters in Massachusetts or California is decisive. An agricultural technology company finds an ideal environment in Iowa or Nebraska. A “one-size fits-all” us strategy is doomed to fail.
- For politics: The European Union and its Member States should not treat the United States as a monolithic block, but should pursue a differentiated foreign trade policy. This means striving for targeted economic, technology and research partnerships with individual states or regional clusters that have complementary strengths. A dialogue about regulatory standards in the area of AI may be more fertile with California than with the Federal Government in Washington DC A cooperation in the area of advanced production could be specifically sought with the governors of the “Rust Belt”.
In summary, it can be said that the United States' understanding as a mosaic of economies is not just an academic exercise, but a strategic necessity. Only those who know the specific strengths, weaknesses and economic logics of California, Texas, New York and their counterparts can fully exhaust the opportunities of the American market and effectively manage their risks.
Detailed comparison tables
Sectoral GDP contributions in comparison (in % of the total BIP, rounded)
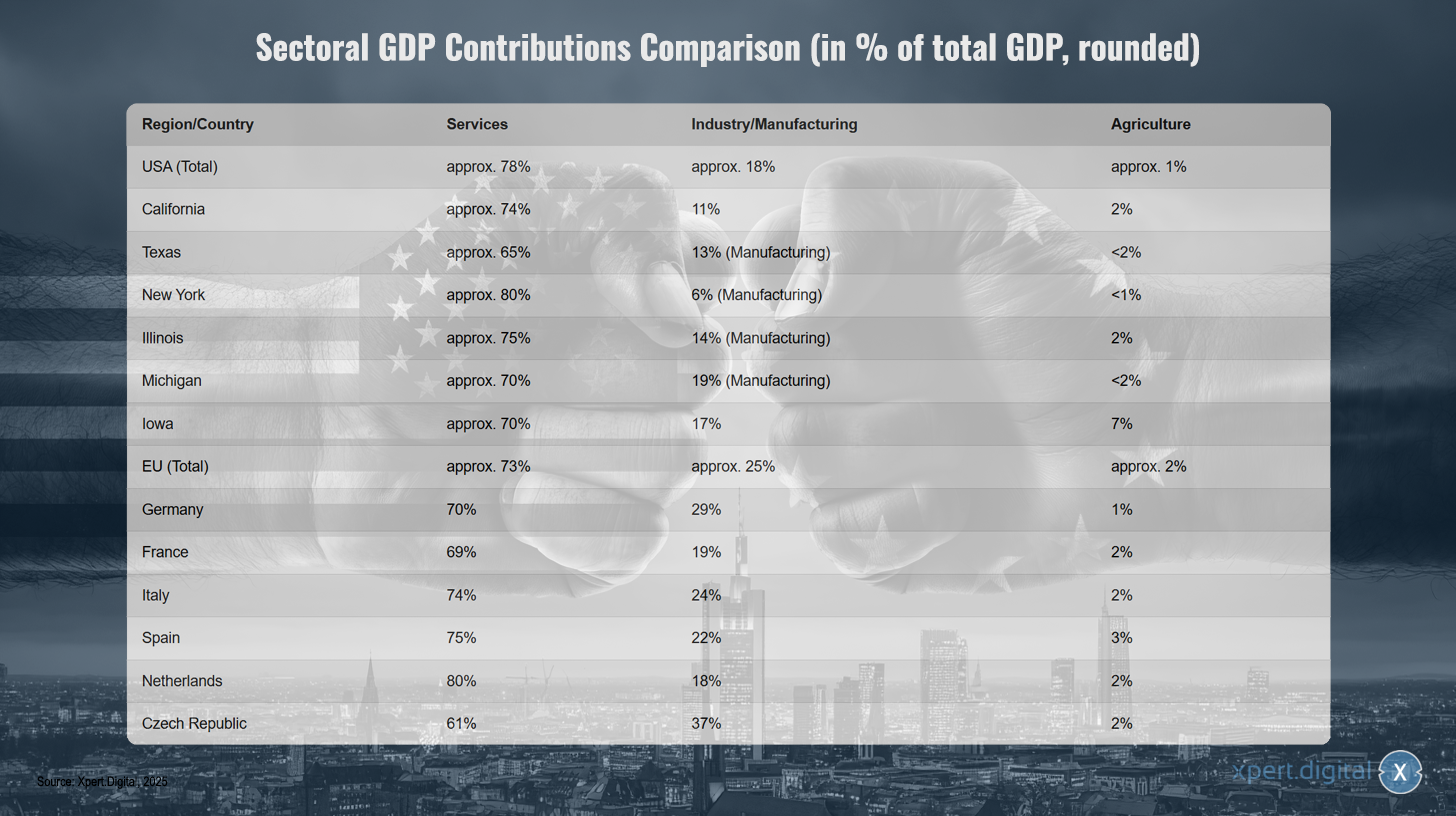
Sectoral GDP contributions in comparison (in % of the total BIP, rounded)-Image: Xpert.digital
The sectoral GDP contributions show clear regional differences in the economic structure. In the United States, the service sector dominates with around 78% of the total BIP, while industry and manufacturing around 18% and agriculture only contribute around 1%. California has a similar structure with 74% share of services, 11% industry and 2% agriculture. With 65% services, 13% production and under 2% agriculture, Texas shows a somewhat stronger industrial character. New York is particularly service -oriented with 80% in this sector, only 6% production and under 1% agriculture. Illinois achieves 75% services, 14% production and 2% agriculture, while Michigan has an above -average proportion of industrial with 70% services and 19% production. IOWA differs significantly from other US states with 70% services, 17% industry and remarkable 7% agriculture.
In the EU, the service share is around 73%, the industry is around 25%and agriculture about 2%. With 70% services, 29% industry and 1% agriculture, Germany shows a strong industrial basis. France achieves 69% services, 19% industry and 2% agriculture. Italy has 74% services, 24% industry and 2% agriculture, while Spain shows a similar structure with 75% services, 22% industry and 3% agriculture. The Netherlands are particularly service -oriented with 80% services, 18% industry and 2% agriculture. Czech Republic stands out with 61% services, 37% industry and 2% agriculture due to the highest proportion of industrial part of all countries listed.
Specialization - key industries and their meaning
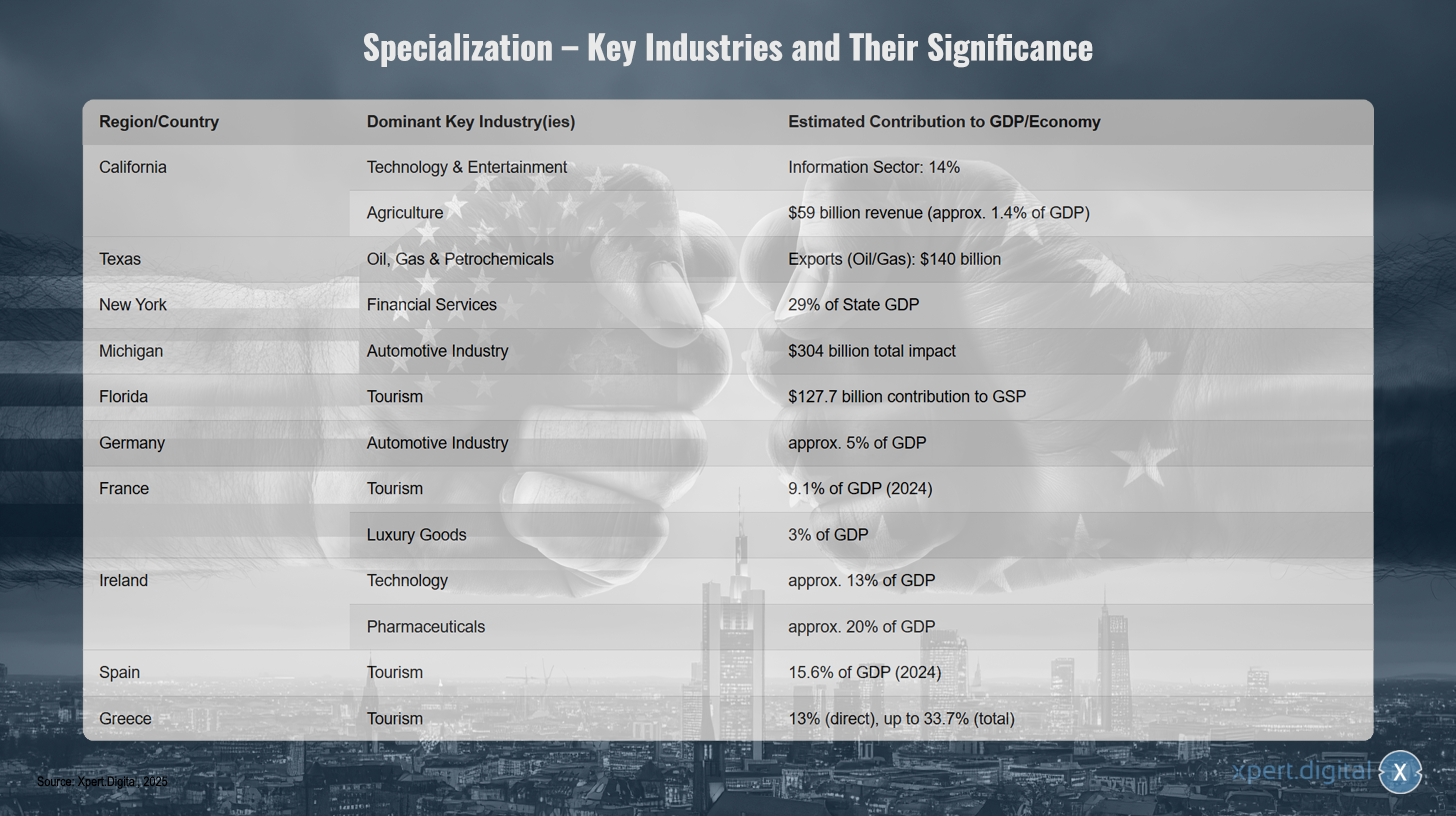
Specialization - key industries and their meaning
The specialization of different regions and countries in certain key industries shows significant economic focus. California dominates with technology and entertainment, whereby the information sector contributes 14% to GDP, while agriculture generates sales of $ 59 billion, which corresponds to about $ 1.4% of GDP. Texas focuses on oil, gas and petrochemistry with exports worth $ 140 billion. New York is strongly shaped by financial services that make up 29% of the state BIP. Michigan stands for the automotive industry with an overall effect of $ 304 billion, while Florida benefits from tourism, which contributes $ 127.7 billion to the gross national product.
At the international level, Germany is also strongly represented in the automotive industry, which is about 5% of GDP. France relies on tourism with 9.1% of GDP in 2024 and luxury goods with 3% of GDP. Ireland specializes in the technology of around 13% of GDP as well as in the pharmaceuticals with around 20% of GDP. Spain is strongly dependent on the tourism with 15.6% of GDP in 2024. Greece shows the greatest dependence on tourism with a 13% direct contribution to GDP, which increases to up to 33.7% if you look at the entire effects.
Economic balance of power: The largest EU people's economies in direct comparison
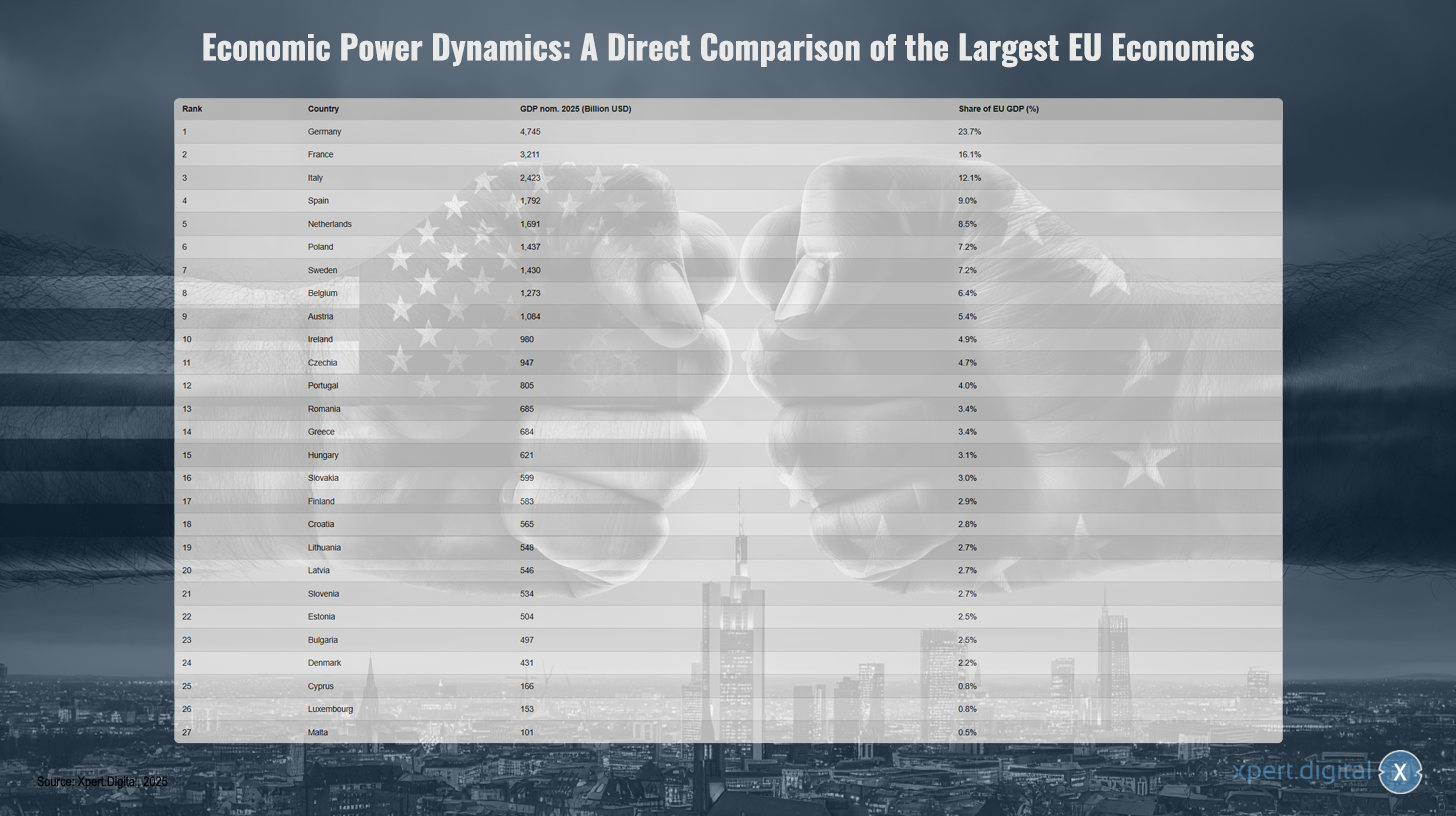
Economic balance of power: The largest EU people's economies in direct comparison-Image: Xpert.digital
The economic balance of power within the European Union is largely determined by a few countries. With a nominal gross domestic product (GDP) of $ 4,745 billion in 2025, Germany is clearly the EU's strongest economy and contributes 23.7 percent to the total EU GDP. France follows with a GDP of $ 3,211 billion and a share of 16.1 percent. Italy took third place with $ 2,423 billion and a share of $ 12.1 percent, followed by Spain ($ 1,792 billion; $ 9.0 percent) and the Netherlands ($ 1,691 billion). Poland, Sweden and Belgium, each with over $ 1,200 billion, and shares between 6.4 and 7.2 percent also contribute significantly to European economic output. Austria, Ireland and the Czech Republic are between 947 and $ 1,084 billion in the middle of the field between 947 and $ 1,084 billion and shares between 4.7 and 5.4 percent. The other countries, including Portugal, Romania, Greece, Hungary, Slovakia, Finland, Croatia, Lithuania, Latvia, Slovenia, Estonia, Bulgaria and Denmark, move with GDP shares of under 4.5 percent each. The smaller economies Cyprus, Luxembourg and Malta together make up less than two percent of the total EU bip. This distribution underlines great economic heterogeneity within the European Union, with the largest six economies already making up more than two thirds of the total economic output.
California and Texas as economic engines: the current GDP ranking of the USA
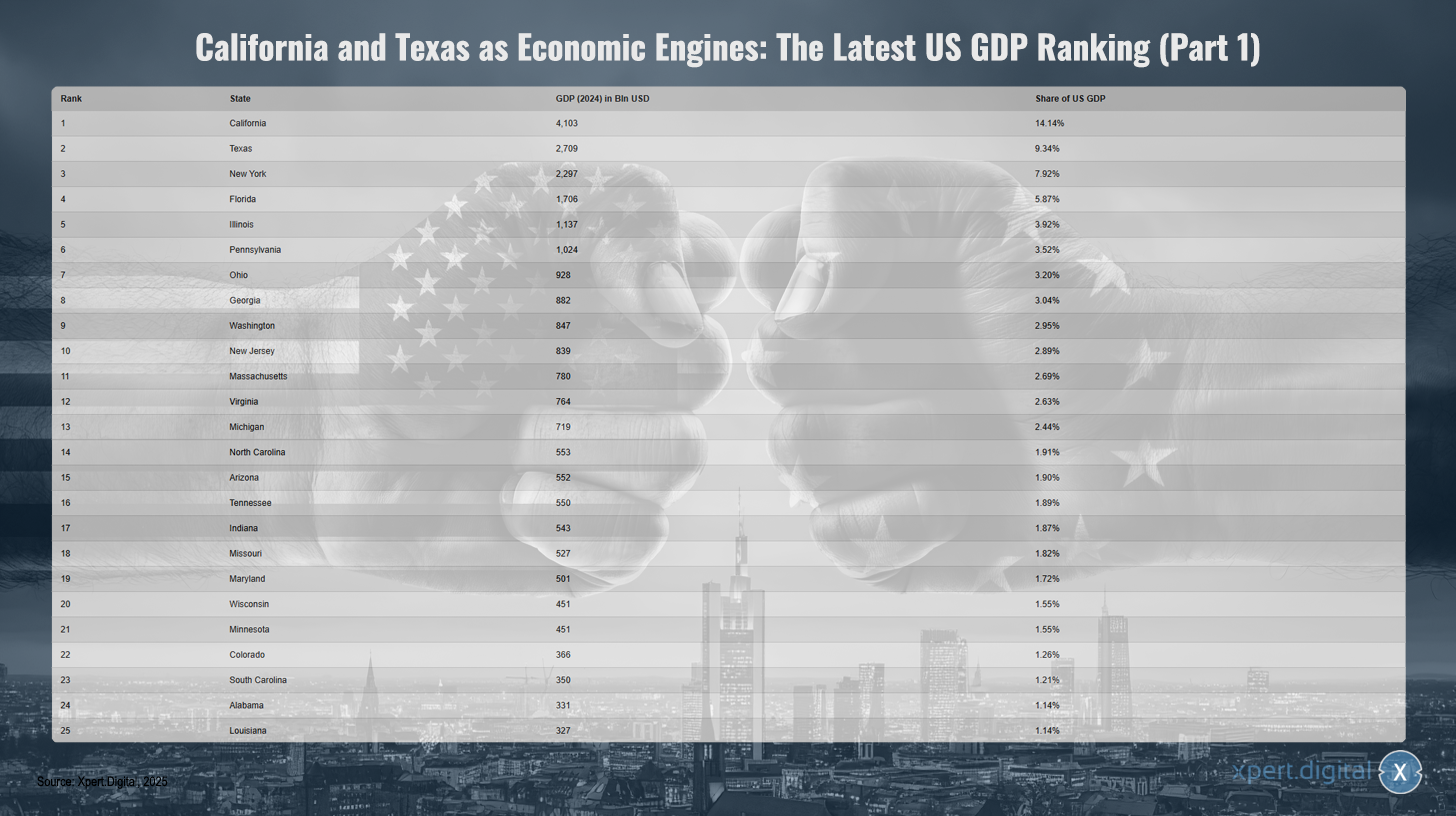
California and Texas as economic engines: The current GDP ranking of the USA (Part 1)-Image: Xpert.digital
California and Texas are considered the most important economic engines in the United States. In the current GDP ranking of the US states for 2024, California with a gross domestic product of $ 4,103 billion occupies first place and thus contributes 14.14 % to the total economic output of the United States. Texas follows with $ 2,709 billion and a share of 9.34 %. In third place is New York with $ 2,297 billion and $ 7.92 %. Behind it is Florida with $ 1,706 billion (5.87 %) and Illinois with $ 1,137 billion (3.92 %). Other economic states are Pennsylvania, Ohio, Georgia, Washington and New Jersey, which each contribute between 780 and $ 1,024 billion to US GOPP. The other places are taken by states such as Massachusetts, Virginia, Michigan and North Carolina. The GDP of the other states is sometimes significantly below, even at the lower end of the list-such as Vermont or Wyoming-despite a small share of the overall BIP, respectable economic services are still performed. What is striking is the enormous economic weighting of the leading states compared to the large number of smaller states, which underlines the strong concentration of economic performance within the United States.

California and Texas as economic engines: The current GDP ranking of the USA (Part 2)-Image: Xpert.digital
Xpaper AIS - R&D for Business Development, Marketing, PR and Content Hub

Xpaper AIS Ais Possibilities for Business Development, Marketing, PR and our Industry Hub (Content) - Image: Xpert.digital
This article was "written". My self-developed R&D research tool 'Xpaper' used, which I use in a total of 23 languages, especially for global business development. Stylistic and grammatical refinements were made in order to make the text clearer and more fluid. Section selection, design as well as source and material collection are edited and revised.
Xpaper News is based on AIS ( Artificial Intelligence Search ) and differs fundamentally from SEO technology. Together, however, both approaches are the goal of making relevant information accessible to users - AIS on the search technology and SEO website on the side of the content.
Every night, Xpaper goes through the current news from all over the world with continuous updates around the clock. Instead of investing thousands of euros in uncomfortable and similar tools every month, I have created my own tool here to always be up to date in my work in the field of business development (BD). The xpaper system resembles tools from the financial world that collect and analyze tens of millions of data every hour. At the same time, Xpaper is not only suitable for business development, but is also used in the area of marketing and PR - be it as a source of inspiration for the content factory or for article research. With the tool, all sources worldwide can be evaluated and analyzed. No matter what language the data source speaks - this is not a problem for the AI. Different AI models are available for this. With the AI analysis, summaries can be created quickly and understandably that show what is currently happening and where the latest trends are-and that with Xpaper in 18 languages . With Xpaper, independent subject areas can be analyzed - from general to special niche issues, in which data can also be compared and analyzed with past periods.
We are there for you - advice - planning - implementation - project management
☑️ Our business language is English or German
☑️ NEW: Correspondence in your national language!

Konrad Wolfenstein
I would be happy to serve you and my team as a personal advisor.
You can contact me by filling out the contact form or simply call me on +49 89 89 674 804 (Munich) . My email address is: wolfenstein ∂ xpert.digital
I'm looking forward to our joint project.