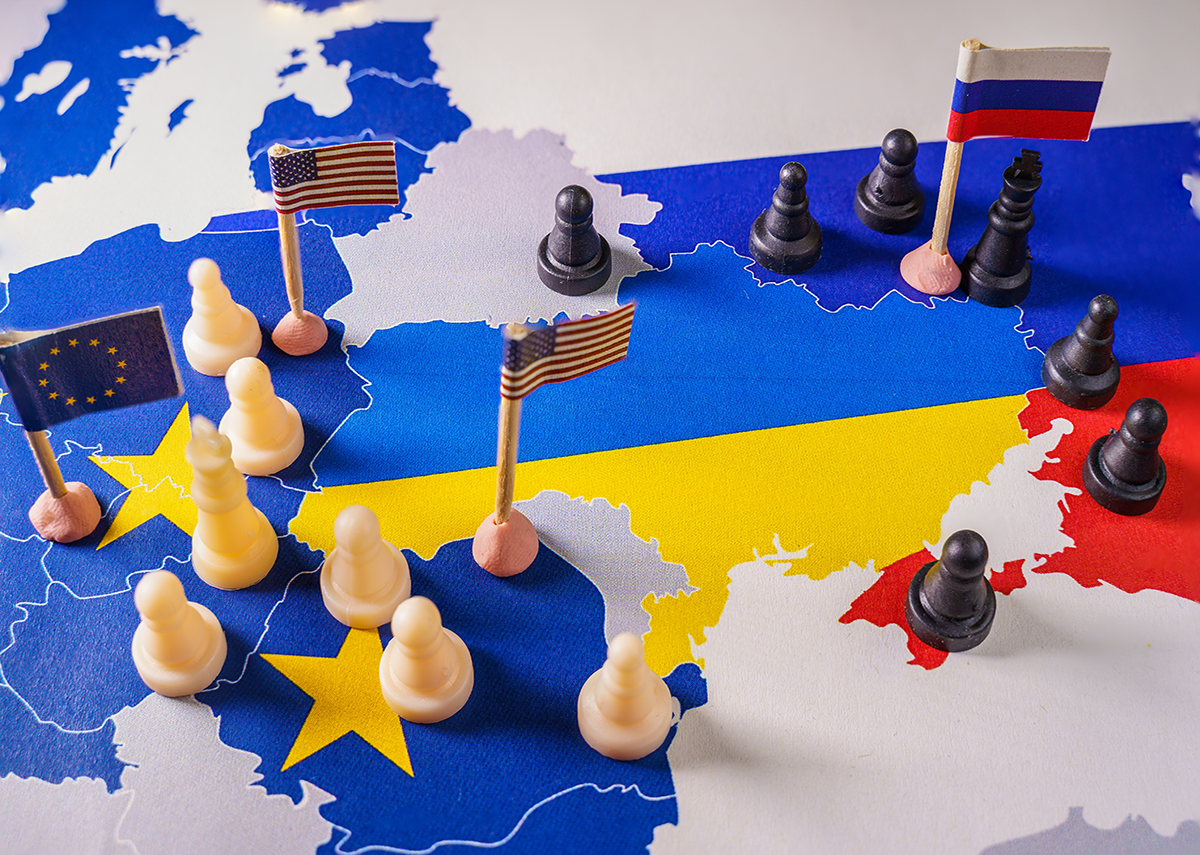
War: A catastrophe for logistics and the supply chain – Image: Ivan Marc|Shutterstock.com
For those unfamiliar with it: War and Peace is a historical novel written in a realistic style by the Russian author Leo Tolstoy. It is considered one of the most important works of world literature. It is a blend of historical fiction and military-political narrative.
An economic war is also a war on the supply chain
As has been described countless times before, globalization has severely strained supply chain structures, making them vulnerable to crises beyond their control and unexpected events. However, it has also failed to strategically raise awareness of these challenges in a relatively short period of time.
This means that even if the Corona pandemic subsides in the future, no easing of the situation along the supply chain in logistics and intralogistics is in sight.
While the media repeatedly invokes Russian nationalism to explain the supposedly one-sided dispute between Russia and Ukraine, a look behind the scenes helps in understanding the further course of action and planning new logistics strategies with regard to the supply chain.
Ultimately, it's always about economic interests and securing existing and new markets. In this case, it's not just about Ukraine itself, but also about leveling the playing field with potential competitors who have an impact on national revenues and jobs.
Gazprom, the top company in Russia, ranks only seventh in international industry comparisons. Ahead of it are US companies like ExxonMobil and Chevron. Great Britain and France are also represented. And China, with PetroChina, is in fifth place. Could this be a possible explanation for why China isn't taking the expected clear stance of support for Russia on the Ukraine issue?
Germany's attempt to free itself from energy dependence through renewable energies is once again pushed far into the future by this escalation, unless German politics consistently continues on its path.
A cynic might see something sinister in this – the question now arises as to why Germany should face a gas shortage when Gazprom's market capitalization is only around 8% of the global market? A gas shortage would only occur if the USA, France, and the UK, all NATO members, refused to supply us and were unwilling to do business with us.
The energy market is considered the most important sector of all. Those who aren't at the forefront here lose influence and control over the markets that depend on it. This isn't simply about the good or bad of political actors, but about market dominance and the prosperity that comes with it. Objectively speaking, we are all both beneficiaries and pawns in a system that has become self-perpetuating.
Whether the war was provoked by Russia's nationalist motives or driven by the economic interests of other countries seeking to profit, consciously or unconsciously, from this supposedly one-sided conflict between Russia and Ukraine, the challenges for logistics and intralogistics during and after the COVID-19 pandemic in relation to globalization will not diminish. They will become more complex and demanding, disrupting most supply chain strategies.
Related to this:
Leading oil and gas producers by market capitalization, October 2021

Leading oil and gas producers – Image: Xpert.Digital
Exxon Mobil has the highest market capitalization of any oil and gas producer worldwide. As of October 4, 2021, the US-based company had a market capitalization of US$257.95 billion. Of the ten largest companies, five were classified as Big Oil companies. The Indian conglomerate Reliance Industries, which operates the world's largest oil refining complex and is also active in retail and telecommunications, ranked second with a market capitalization of over US$226 billion.
KPIs of leading oil and gas companies
While the number of companies that rank among the largest in their respective industries has remained largely unchanged, their rankings vary depending on the metric used. Although ExxonMobil is frequently ranked first in terms of market capitalization, China's Sinopec was identified as the world's leading oil and gas company based on revenue in the 2020/2021 fiscal year, with ExxonMobil ranking third. At the same time, state-owned enterprises such as Gazprom and PetroChina are the world's leading oil and gas companies in terms of employment, each employing more than 430,000 people in 2021.
Most valuable providers of oil equipment and services
Enbridge, a Canadian company, is the world's largest oil and gas equipment supplier and service provider by market capitalization, with outstanding shares valued at US$80.97 billion as of October 4, 2021. Oilfield service providers are typically not involved in oil production but instead provide services to companies engaged in exploration and production, such as leasing drilling rigs or transporting oil and gas to refineries and consumer markets.
World's leading oil and gas companies based on market capitalization in October 2021
- ExxonMobil, USA – $257.95 billion
- Reliance Industries, India – US$226.5 billion
- Chevron, United States – US$201.77 billion
- Royal Dutch Shell, Great Britain – US$173.36 billion
- PetroChina, China – US$161.02 billion
- TotalEnergies, France – 126.24 billion US dollars
- Gazprom, Russia – 117.56 billion US dollars
- ConocoPhillips, US – $93.87 billion
- BP, Great Britain – US$91.19 billion
- Rosneft, Russia – 89.95 billion US dollars
Shareholder structure of the gas company Gazprom
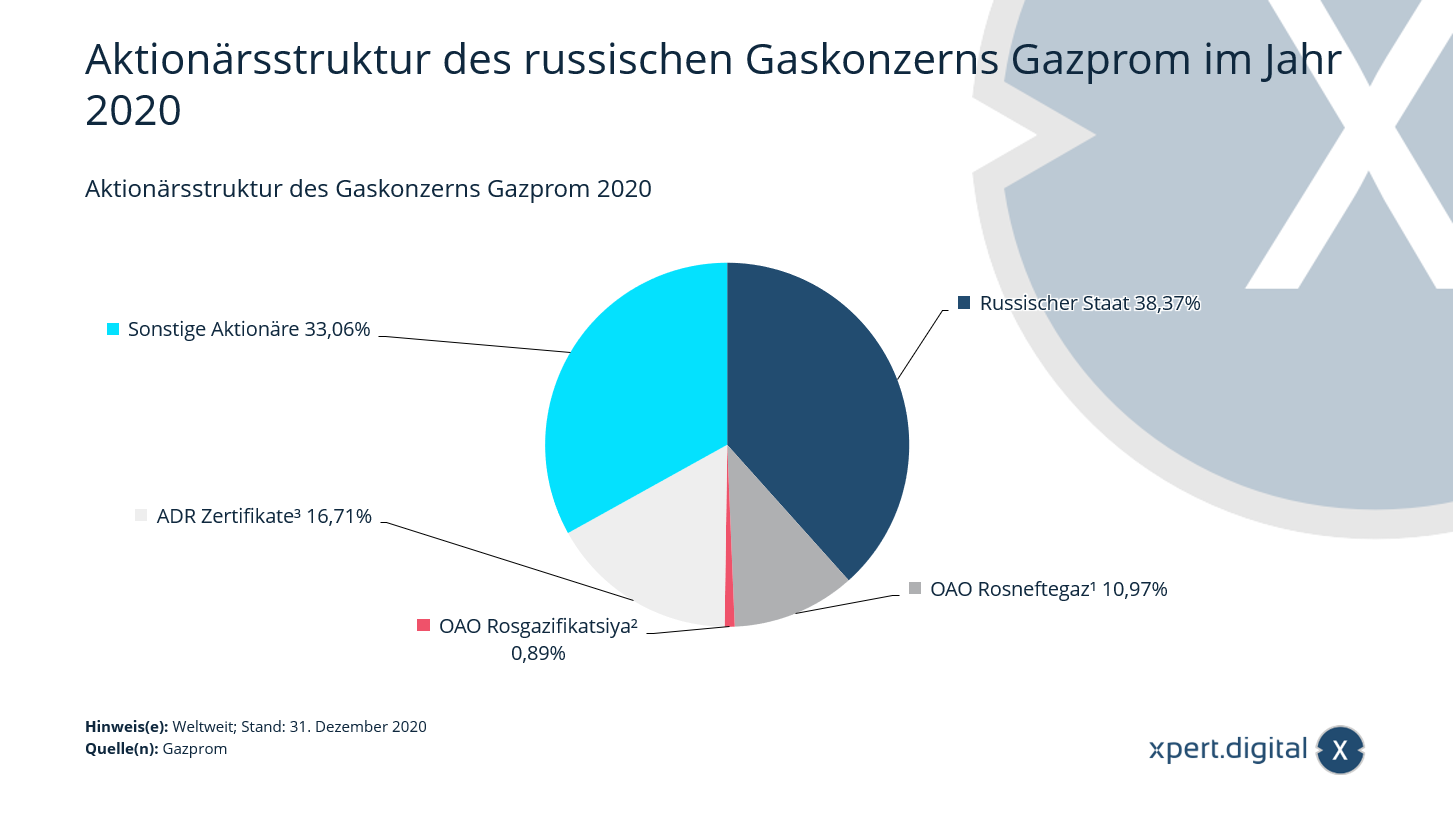
Shareholder structure of the gas company Gazprom – Image: Xpert.Digital
This statistic shows the shareholder structure of the gas company Gazprom in 2020. In that year, Bank of New York Mellon owned approximately 17 percent of the shares of Gazprom, the world's largest natural gas producer. Gazprom became a joint-stock company in 1992 and was previously a Russian state-owned enterprise. In 2020, the Russian state's aggregate stake in Gazprom amounted to just over 50 percent.
¹ As of December 31, 2020, the Russian state held 100% of the shares of Rosneftgaz.
² As of December 31, 2020, OAO Rosneftgaz held a total of 74.55% of the shares of OAO Rosgazifikatsiya.
³ American Depositary Receipt (ADR), share certificates or depositary receipts issued by US depositary banks. As of December 31, 2020, Bank of New York Mellon traded ADRs on Gazprom shares in the specified amount.
Shareholder structure of the Russian gas company Gazprom in 2020
- Russian state – 38.37%
- OAO Rosneftegaz¹ – 10.97%
- OAO Rosgazifikatsiya² – 0.89%
- ADR certificates³ – 16.71%
- Other shareholders – 33.06%
NATO's Gross Domestic Product (GDP) compared to Russia
Another attempt to explain the economic background of why Russia wants to prevent any NATO influence on Ukraine while there is still time: NATO's eastward expansion also has an economic and not just a purely security policy aspect.
Gross domestic product (GDP) reflects a country's economic performance. It is calculated from all goods and services produced within a country's borders over a specific period. In comparison, Russia, once a major political power, is a dwarf, though it can still strategically position itself and maintain influence in the energy sector. Does this war now demonstrate that Russia is resorting to its last resort and has exhausted all its options?
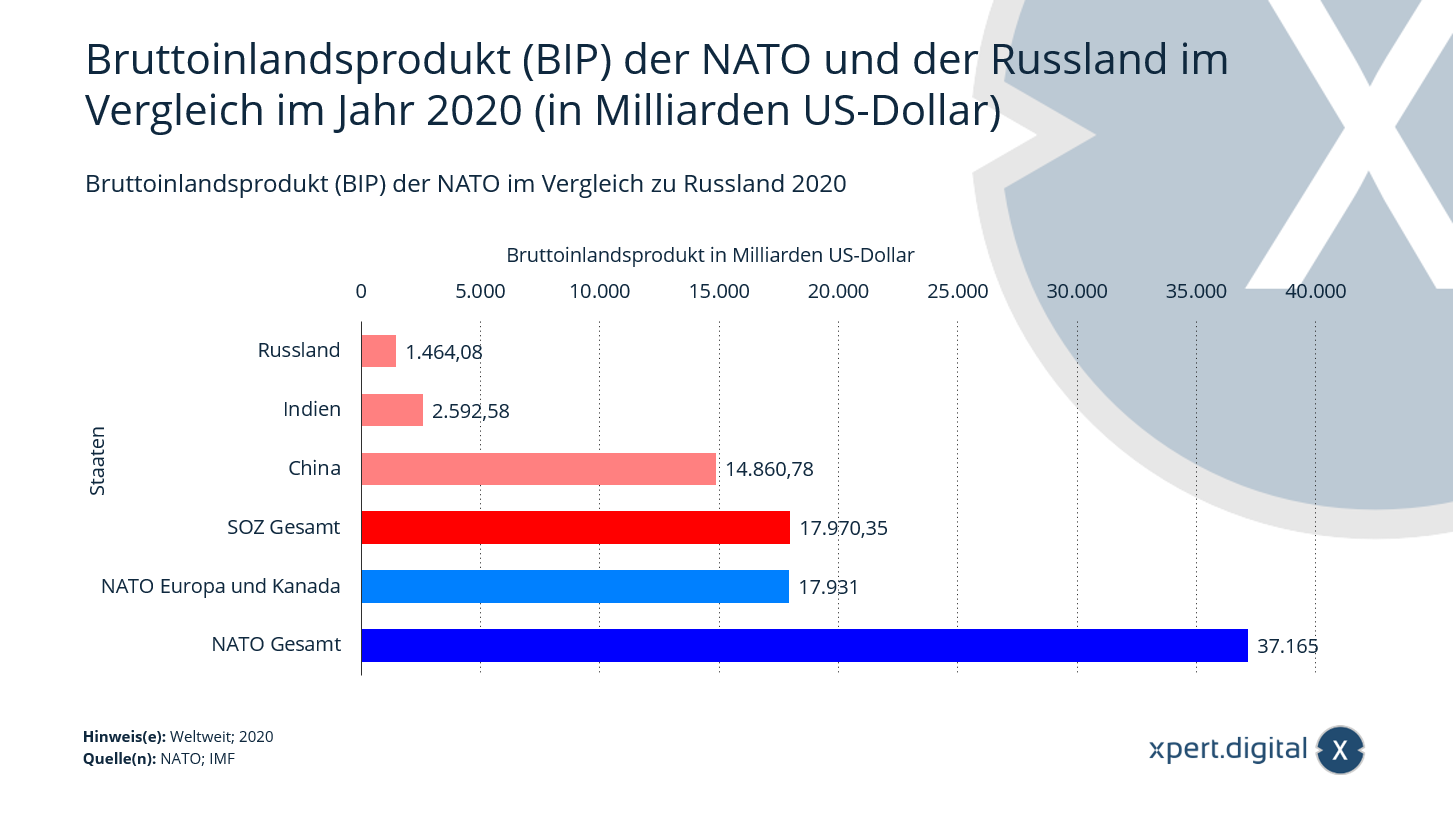
NATO's gross domestic product (GDP) compared to Russia – Image: Xpert.Digital
In 2020, NATO member states together generated an estimated gross domestic product (GDP) of approximately US$37.17 trillion. This represents roughly 45 percent of global GDP. The member states of the Shanghai Cooperation Organisation (SCO), with a GDP of approximately US$17.93 trillion, have a significantly smaller economic output.
What is NATO – North Atlantic Treaty Organization?
NATO is a military alliance currently comprised of 30 European and North American states. NATO's main tasks lie in the areas of security and defense policy, conflict prevention and crisis management, as well as disarmament and arms control. In 2014, NATO set the goal that each member state would invest at least two percent of its gross domestic product (GDP) in defense by 2025. So far, only the USA, Greece, Estonia, Latvia, and the United Kingdom have met this target. See also the statistics on the share of military spending in GDP in NATO countries.
Shanghai Cooperation Organisation (SCO)
The Shanghai Cooperation Organisation (SCO) was founded in 2002 with the aim of strengthening trust and cooperation among its eight member states in various areas, including trade and security policy. The SCO represents approximately 40% of the world's population and is seen by some observers as an international counterweight to NATO. The following states are members of the organization:
- China
- Kazakhstan
- Kyrgyzstan
- Russia
- Tajikistan
- Uzbekistan
- India (since 2017)
- Pakistan (since 2017)
Gross Domestic Product (GDP) of NATO and Russia compared in 2020
- NATO total – 37.165 billion US dollars
- NATO Europe and Canada – 17.931 billion US dollars
- SOC Total – US$17,970.35 billion
- China – 14,860.78 billion US dollars
- India – US$2,592.58 billion
- Russia – 1,464.08 billion US dollars
Top 20 companies in Russia by revenue
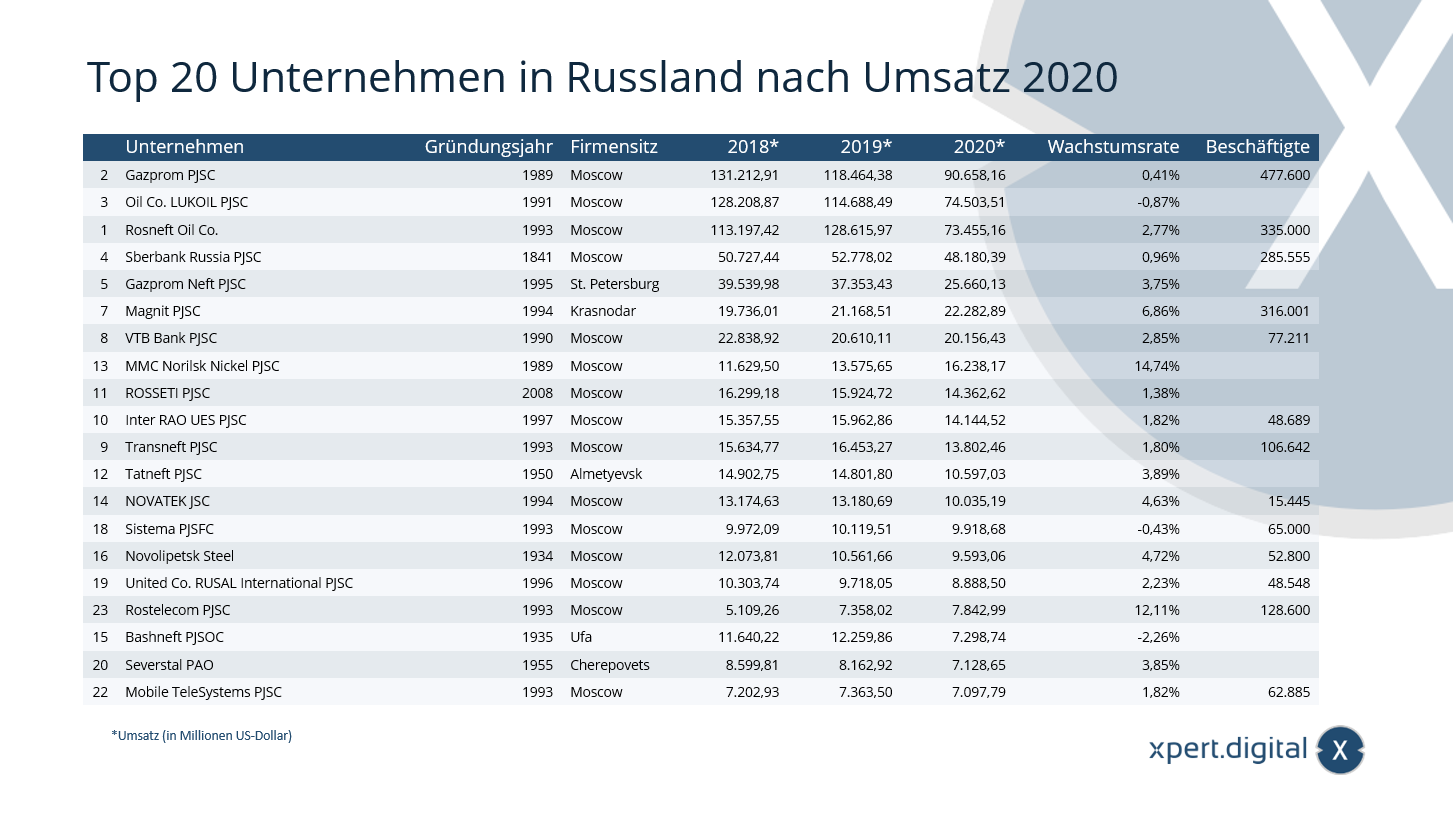
Top 20 companies in Russia by revenue – Image: Xpert.Digital
Top 20 companies in Moscow by revenue
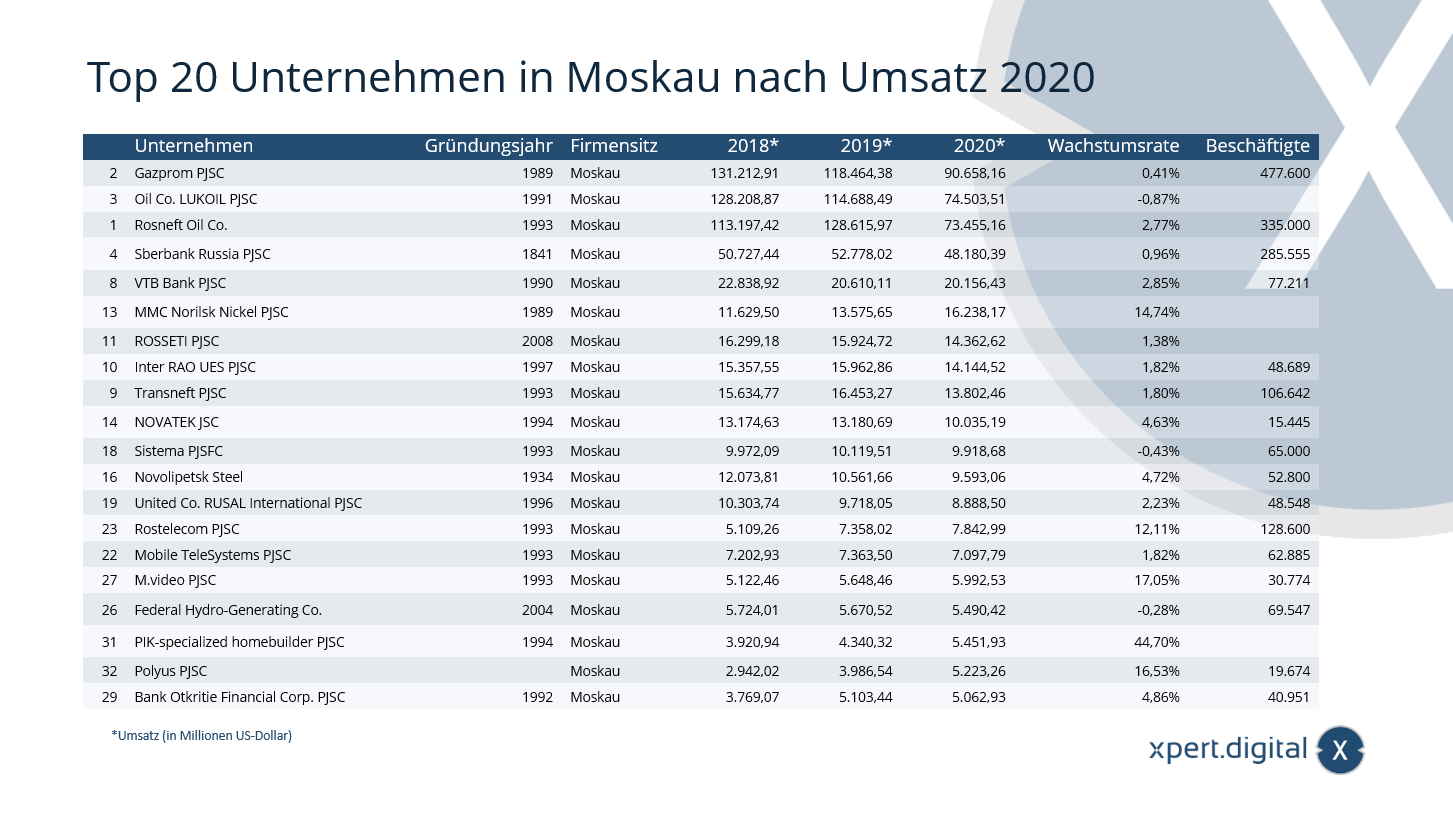
Top 20 companies in Moscow by revenue – Image: Xpert.Digital
Top 20 companies in Russia by year of foundation
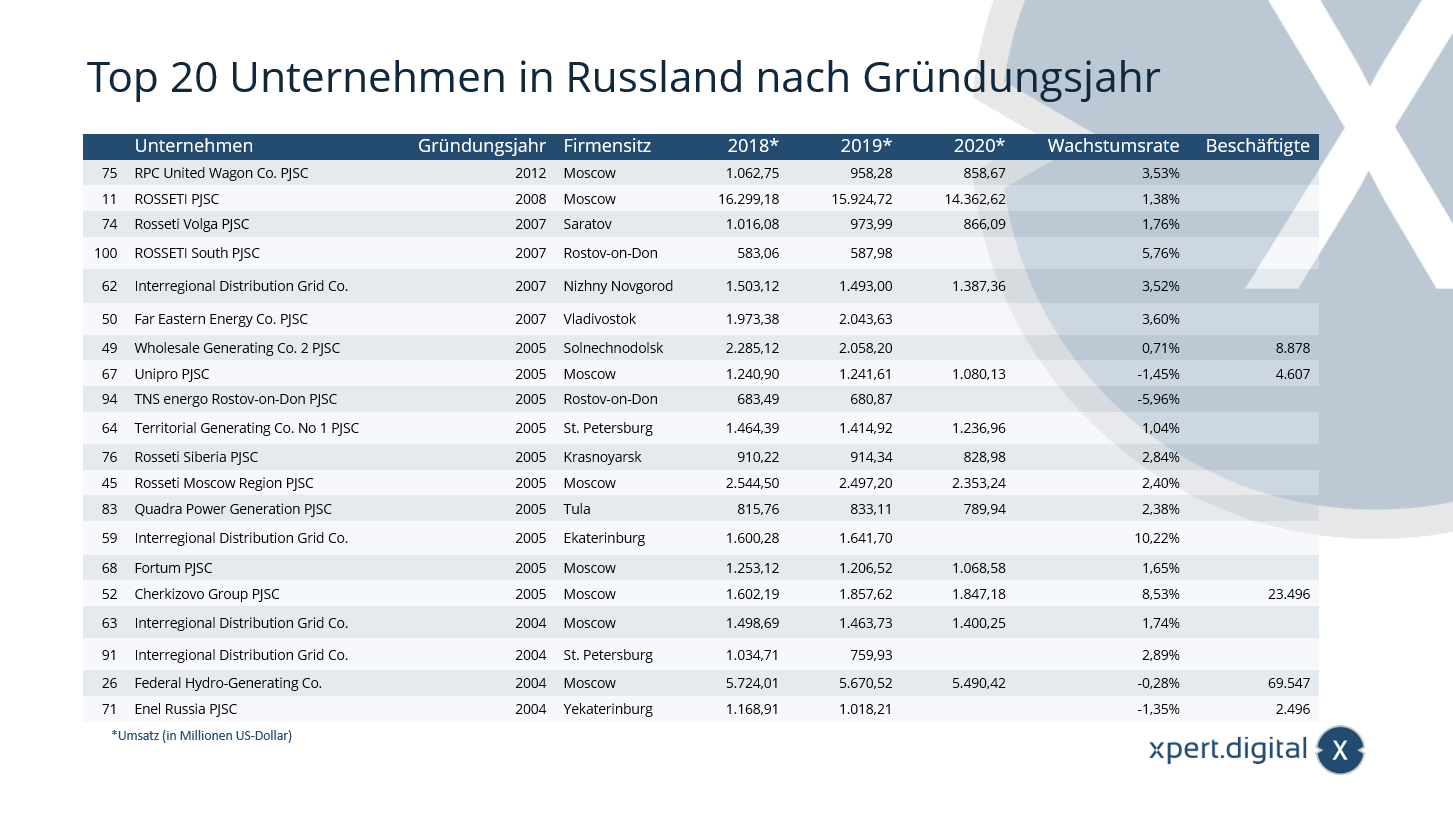
Top 20 companies in Russia by year of foundation
Top 20 companies in Moscow by year of foundation
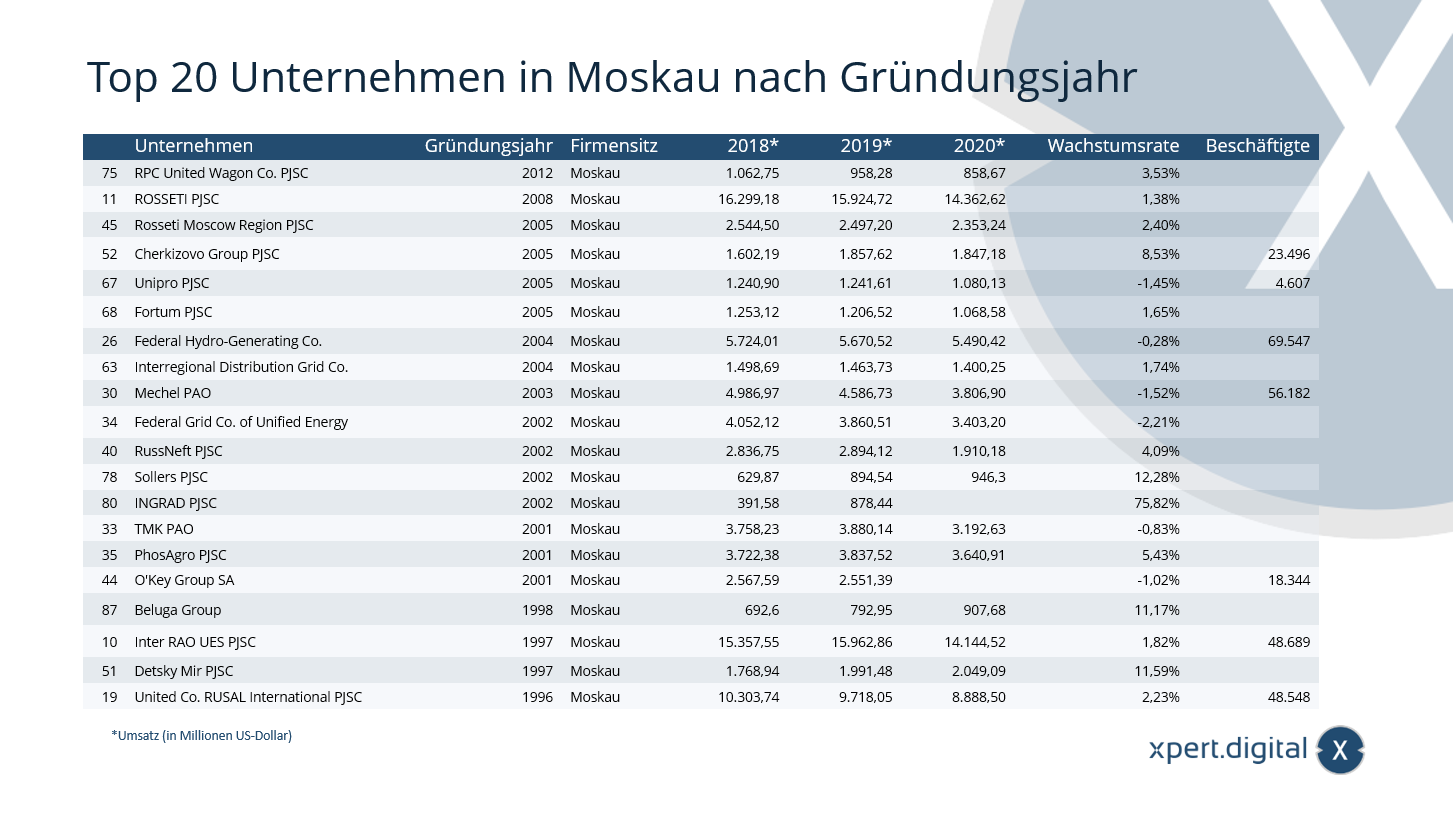
Top 20 companies in Moscow by year of foundation – Image: Xpert.Digital
Keep in touch