Switch to English version


Record share – Renewable Energy Management – Image: ConceptCafe|Shutterstock.com
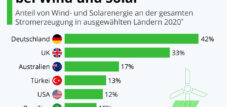
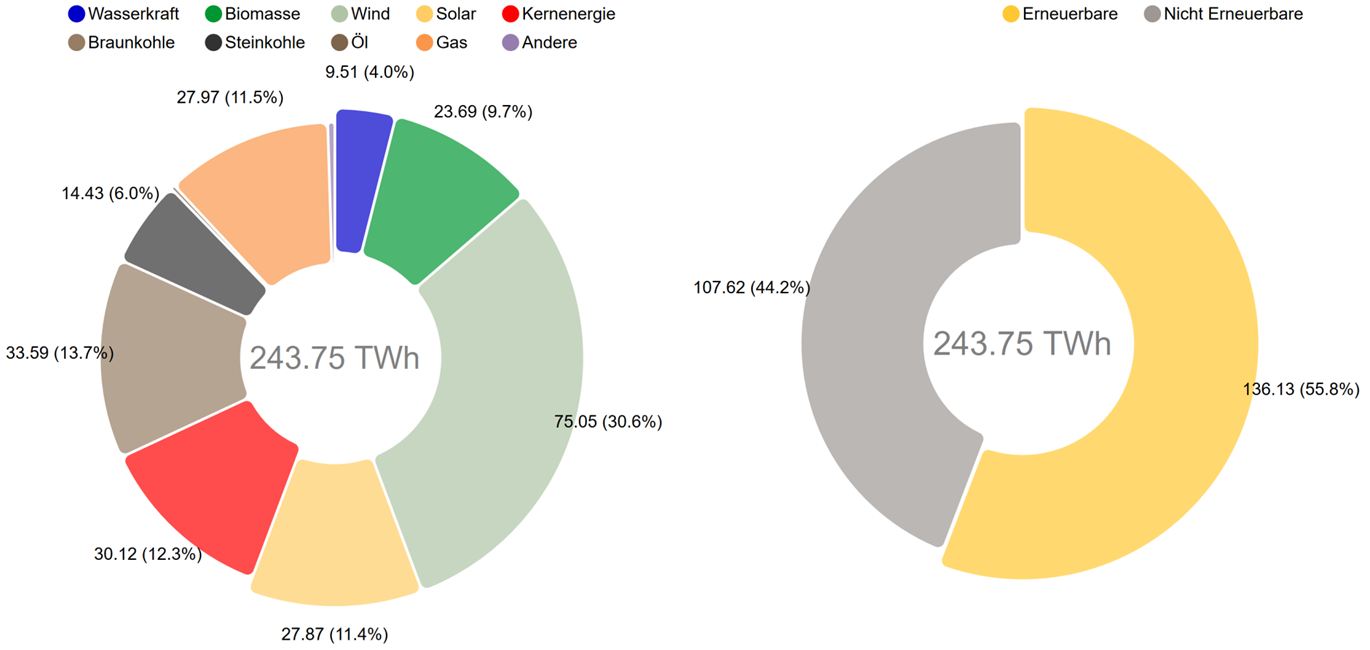
Net electricity generation in the first half of 2020: On July 1st, the Fraunhofer Institute for Solar Energy Systems ISE presented data on net public electricity generation for the first half of 2020, derived from the Energy-Charts data platform. With a share of 55.8 percent of net electricity generation for public use – that is, the electricity mix that comes out of the socket – renewable energies set a new record. In February, their share was even higher at 61.8 percent. Solar and wind power plants together fed 102.9 terawatt-hours (TWh) into the public grid, compared to 92.3 TWh in the first half of 2019. In contrast, electricity production from coal declined sharply: the share of lignite fell to 13.7 percent, and hard coal to just 6 percent. Wind energy, with a share of 30.6 percent, was once again the strongest energy source.
Net electricity generation from power plants for public electricity supply – © Fraunhofer ISE, Graphic: B. Burger, Source: https://www.energy-charts.de
The graphic above shows the net electricity generation from power plants for public supply. This is the electricity mix that actually comes out of the socket. Generation from power plants of "manufacturing companies and those in mining and quarrying," i.e., industrial generation for own consumption, is not included in this representation.
The effects of the Corona pandemic are noticeable
From the second quarter of 2020 onward, the reduced electricity demand due to the decline in industrial production caused by the COVID-19 pandemic became noticeable. Load fell to 35.3 TWh in June (June 2019: 37.6 TWh), while electricity production dropped from 47.9 TWh in January to 36.0 TWh in June. Overall, load in the first half of the year was 234.2 TWh, a significant decrease compared to the 245.7 TWh in the first half of 2019. Electricity production fell by 21.7 TWh compared to the first half of 2019, to 243.8 TWh. Part of this decline is attributable to the drop in exports from 20.1 TWh to 7.5 TWh.
Renewable energies driven by strong winds
Photovoltaic systems fed approximately 27.9 TWh into the public grid in the first half of the year, an increase of 11.2 percent compared to the previous year (25.1 TWh). The solar power plants benefited from favorable weather conditions, which allowed for more than 6 TWh of electricity production per month from April to June.
Wind energy produced approximately 75 TWh in the first half of 2020, roughly 11.7 percent more than in the first half of 2019 (67.2 TWh). Due to numerous winter storms, its share even rose to 45 percent of net electricity generation in February. Hydropower produced approximately 9.5 TWh in the first half of the year, a decrease of 9 percent compared to the previous year (10.5 TWh). Biomass generated approximately 23.7 TWh, a slight increase compared to the previous year.
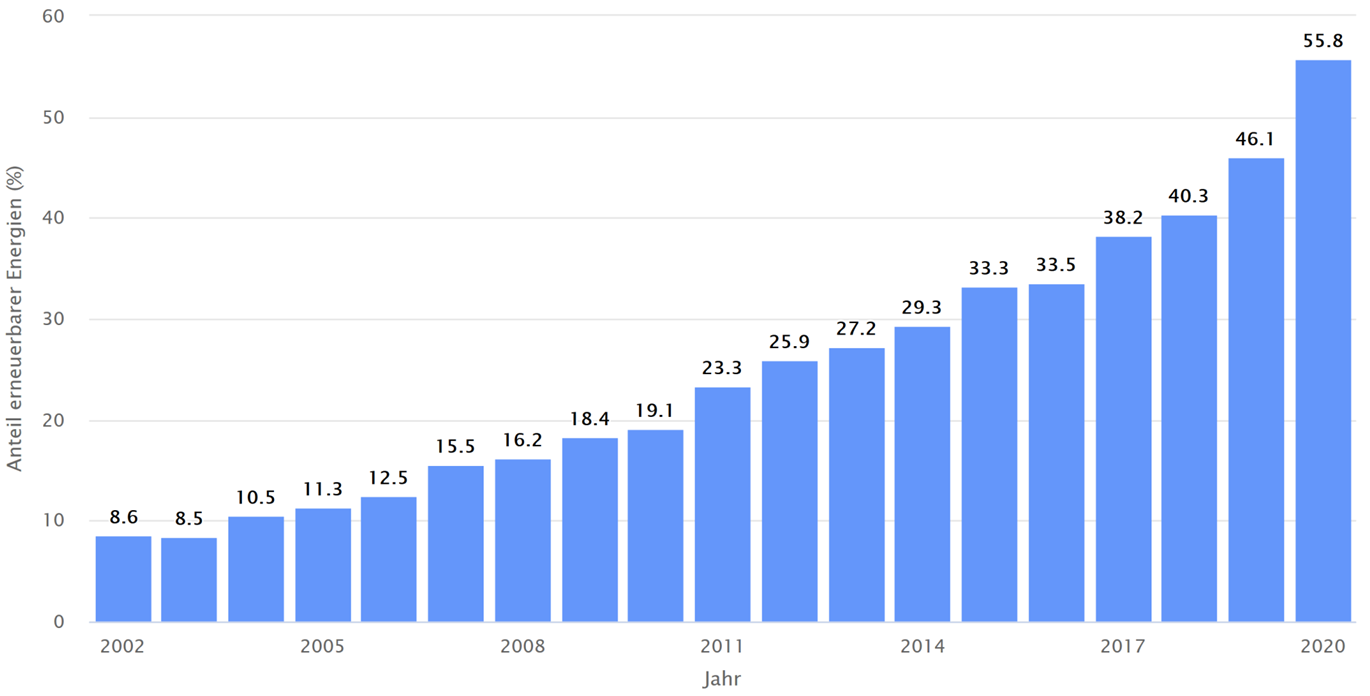
In total, renewable energy sources – solar, wind, hydro, and biomass – produced approximately 136.1 TWh in the first half of 2020 (previous year: 125.6 TWh). Their share of net public electricity generation, i.e., the electricity mix that actually comes out of the socket, is approximately 55.8 percent, a significant increase compared to 2019 (47 percent). For the first time, the share of renewable energies in total gross electricity generation has exceeded 50 percent. Gross generation also includes the self-generation of industry (manufacturing companies as well as those in mining and quarrying) and the internal losses of conventional power plants. Neither of these components is fed into the public electricity grid.
Coal-fired power generation sharply declining – “fuel switch” to natural gas
Net electricity production from nuclear power plants in the first half of 2020 was approximately 30.1 TWh, a decrease of 12.9 percent compared to the same period of the previous year (34.6 TWh). Lignite-fired power plants produced approximately 33.6 TWh net, which is 19.1 TWh, or 36.3 percent, less than in the first half of 2019. Net production from hard coal-fired power plants plummeted by 46 percent to just 14.4 TWh. This sharp decline is due to the increased costs of CO₂ certificates, which averaged €21.91 per ton of CO₂, and the significantly lower day-ahead electricity price on the exchange, averaging €22.94/MWh (compared to €36.83/MWh in 2019). With emissions of approximately 1 ton of CO₂ per megawatt hour of coal-fired electricity generated, the economic viability of coal-fired power plants was hardly guaranteed anymore.
Since the price of natural gas halved during the same period (8.03 euros/MWh instead of 16.38 euros in 2019) and natural gas power plants have lower CO₂ certificate costs, a "fuel switch" from coal to natural gas took place.
Gas-fired power plants increased their production to 28 TWh, a rise of 13.9 percent compared to 24.6 TWh in the previous year. In addition to power plants supplying the public electricity grid, there are also gas-fired power plants in the mining and manufacturing sectors for their own electricity generation. These produced an additional 20 TWh for their own industrial use.
Electricity consumption and grid losses from 2015 to 2020

Electricity consumption and grid losses 2015 to 2020 – © Fraunhofer ISE, Graphic: B. Burger, Source: https://www.energy-charts.de
Comparison of load from January to June in the years 2015 to 2020. The load includes electricity consumption and grid losses, but not pumped electricity consumption and the self-consumption of conventional power plants.
Share of renewable energies in net electricity generation 2002 – 2020
Share of renewable energies in net electricity generation – © Fraunhofer ISE, Graphic: B. Burger, Source: https://www.energy-charts.de
Net electricity generation in the first half of 2020: On July 1, the Fraunhofer Institute for Solar Energy Systems ISE presented the data on public net electricity generation for the first half of 2020, which are derived from the Energy Charts data platform. With a 55.8 percent share of net electricity generation in public power generation – ie the electricity mix that comes out of the socket – renewable energies set a new record. In February, their share was as high as 61.8 percent. Solar and wind power plants together fed 102.9 terawatt hours (TWh) into the public grid, compared with 92.3 TWh in the first half of 2019. In contrast, electricity production from coal fell sharply: the share of lignite fell to 13.7 percent, while hard coal now accounts for only 6 percent. Wind power was again the strongest source of energy, accounting for 30.6 percent.
Net electricity generation from power plants for public power supply – © Fraunhofer ISE, graphic: B. Burger, source: https://www.energy-charts.de
The chart above shows the net electricity generation from power plants for public supply. This is the electricity mix that actually comes out of the socket. The generation from power plants of “companies in the manufacturing industry as well as in mining and quarrying”, i.e. industrial generation for own consumption, is not included in this figure.
Consequences of the corona pandemic noticeable
From the second quarter of 2020, the lower demand for electricity became noticeable due to the decline in industrial production caused by the corona pandemic. Load dropped to 35.3 TWh in June (June 2019: 37.6 TWh), while electricity production fell from 47.9 TWh in January to 36.0 TWh in June. In total, the load in the first half of the year was 234.2 TWh, a significant decrease from 245.7 TWh in the first half of 2019. Electricity production fell by 21.7 TWh to 243.8 TWh compared to the first half of 2019. Part of this decline is attributable to the drop in exports from 20.1 TWh to 7.5 TWh.
Renewable energies driven by strong wind
In the first half of the year, photovoltaic systems fed approx. 27.9 TWh into the public grid, an increase of 11.2 percent compared with the previous year (25.1 TWh). The solar power systems benefited from the favorable weather conditions, which allowed more than 6 TWh of electricity to be produced per month from April to June.
Wind power produced about 75 TWh in the first half of 2020 and was therefore about 11.7 per cent above the production in the first half of 2019 (67.2 TWh). Due to the numerous winter storms, its share even rose to 45 percent of net electricity generation in February. Hydroelectricity production in the first half of the year was approximately 9.5 TWh, down 9 percent from 10.5 TWh in the prior-year period. Approximately 23.7 TWh were produced from biomass, a slight increase compared to the previous year.
In total, the renewable energy sources solar, wind, hydro and biomass produced approx. 136.1 TWh in the first half of 2020 (previous year: 125.6 TWh). The share of public net electricity generation, ie the electricity mix that actually comes out of the socket, is approx. 55.8 percent, a sharp increase compared to 2019 (47 percent). The share of renewable energies in total gross electricity generation exceeds 50 percent for the first time. Gross generation also includes the industry's own production (companies in the manufacturing sector as well as in mining and quarrying) and the internal losses of conventional power plants. Both shares are not fed into the public power grid.
Coal-fired power sharply declines- “Fuel Switch” to natural gas
Net electricity generation from nuclear power plants amounted to approx. 30.1 TWh in the first half of 2020, a decline of 12.9 percent compared to the previous year's level (34.6 TWh). Lignite-fired power stations produced approx. 33.6 TWh net. This is 19.1 TWh or 36.3 percent less than in the first half of 2019. Net production from hard coal-fired power stations slumped 46 percent to just 14.4 TWh. This sharp decline is due to the increased cost of CO₂ certificates, which averaged Euro 21.91 per ton CO₂, and the sharp drop in the day-ahead exchange electricity price of Euro 22.94/MWh on average (compared with Euro 36.83/MWh in 2019). With an emission load of about 1 ton CO₂ per generated megawatt hour of coal-fired electricity, the economic viability of coal-fired power plants was hardly given.
As the price for natural gas halved in the same period (8.03 Euro/MWh instead of 16.38 Euro in 2019) and natural gas power plants have lower CO₂ certificate costs, a “fuel switch” from coal to natural gas took place.
Gas-fired power stations increased their production to 28 TWh, an increase of 13.9 percent compared with the 24.6 TWh in the previous year. In addition to the power plants for public electricity supply, there are also gas-fired power plants in the mining and manufacturing industries to supply their own electricity. These also produced an additional 20 TWh for the company's own industrial needs.
Electricity consumption and grid losses 2015 to 2020
Power consumption and grid losses 2015 to 2020 – © Fraunhofer ISE, graphic: B. Burger, source: https://www.energy-charts.de
Comparison of the load from January to June in the years 2015 to 2020. The load includes electricity consumption and grid losses, but not the pumped electricity consumption and own consumption of conventional power plants.
Share of renewable energies in net electricity generation 2002 – 2020
Share of renewable energies in net electricity generation – © Fraunhofer ISE, graphic: B. Burger, source: https://www.energy-charts.de
Keep in touch