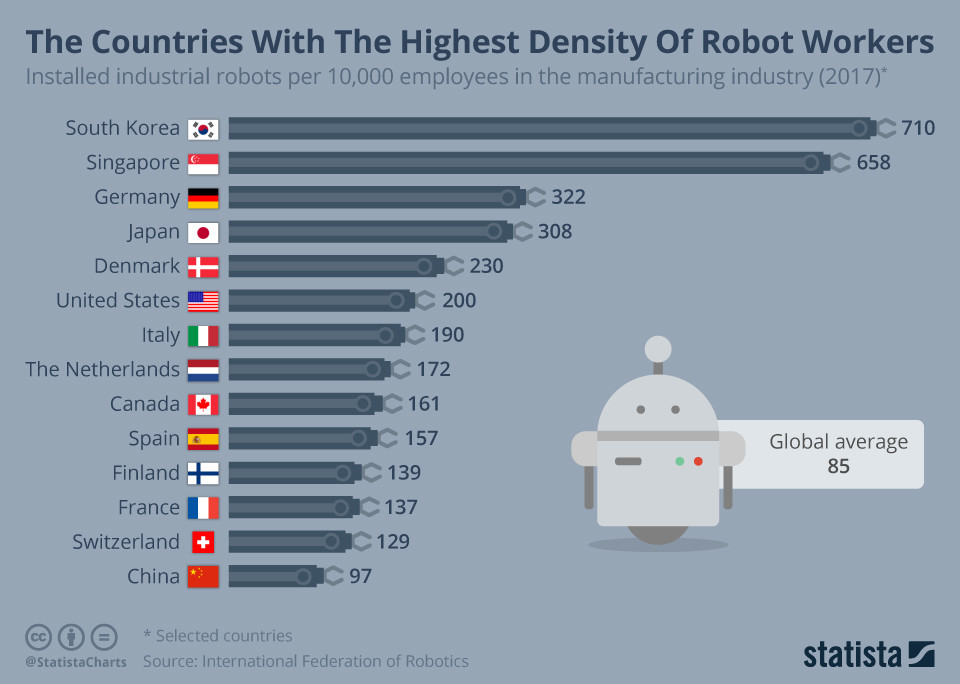
The rise of machines has already begun. Data from the International Federation of Robotics shows that the pace of industrial automation is accelerating in much of the developed world, with 74 industrial robots installed per 10,000 workers globally in 2016. A year later, this figure rose to 85 across the entire manufacturing sector. Europe has a robot density of 106 units per 10,000 workers, while this figure is 91 in the Americas and 75 in Asia. China is one of the countries with the highest growth rates in industrial automation, but nowhere else is there a robot density like that of South Korea.
In 2017, South Korea had 710 industrial robots installed per 10,000 employees. This is primarily due to the ongoing installation of mass-produced robots in the electronics and electrical industries. Ninety percent of Singapore's industrial robots are installed in the electronics industry, and with a density of 658 per 10,000 employees, Singapore ranks second. Germany and Japan, known for their automotive industries, have a density of just over 300 per 10,000 employees. Interestingly, Japan is one of the major players in industrial robotics, accounting for 56 percent of the global supply.
In the United States, the pace of automation is slower, with a robot density of 200. China is striving to increase its level of automation in the coming years and aims to be among the top 10 countries in the world for robot density by 2020. It had a density of 25 units in 2013 and grew to 97 by 2017. In 2017, China already supplied 36 percent of the robots sold.
In the German manufacturing sector, there are 322 industrial robots for every 10,000 employees. Compared to South Korea, the automation of production processes in other Western industrialized nations still has considerable room for improvement, as the graphic shows. Even in China, often called the world's workshop, robots are still relatively rare.
The rise of the machines has well and truly begun. Data from the International Federation of Robotics reveals that the pace of industrial automation is accelerating across much of the developed world with 74 installed industrial robots per 10,000 employees globally in 2016. A year later, that increased to 85 across the manufacturing sector. Europe has a robot density of 106 units per 10,000 workers and that number is 91 and 75 in the Americas and Asia respectively. China is one of the countries recording the highest growth levels in industrial automation but nowhere has a robot density like South Korea.
In 2017, South Korea had 710 installed industrial robots per 10,000 employees. This is mainly due to the continued installation of high volume robots in the electronics and electrical sectors. 90 percent of Singapore's industrial robots are installed in its electronics industry and it comes second with a density of 658 per 10,000 employees. Germany and Japan are renowned for their automotive industries and they have density levels of just over 300 per 10,000 workers. Interestingly, Japan is one of the main players in industrial robotics, accounting for 56 percent of global supply.
In the United States, the pace of automation is slower with a density rate of 200. China is eager to expand its level of automation in the coming years, targeting a place in the world's top-10 nations for robot density by 2020. It had a density rate of 25 units in 2013 and that grew to 97 by 2017. In 2017, China was already supplying 36 percent of the robots sold.
In the German manufacturing industry, there are 322 industrial robots per 10,000 employees. In comparison to South Korea, the automation of production processes in other western industrial nations still has a lot of room for improvement, as the chart shows. Even in China, often also called the world's workbench, the robot colleague is still relatively rare.


You will find more infographics at Statista
Keep in touch