Temporary export champion in climate protection: Germany's green trade balance between triumph and vulnerability
Xpert Pre-Release

Available in 27 languages 📢
Prefer Xpert.Digital on GoogleⓘPublished on: November 14, 2026 / Updated on: November 14, 2026 – Author: Konrad Wolfenstein
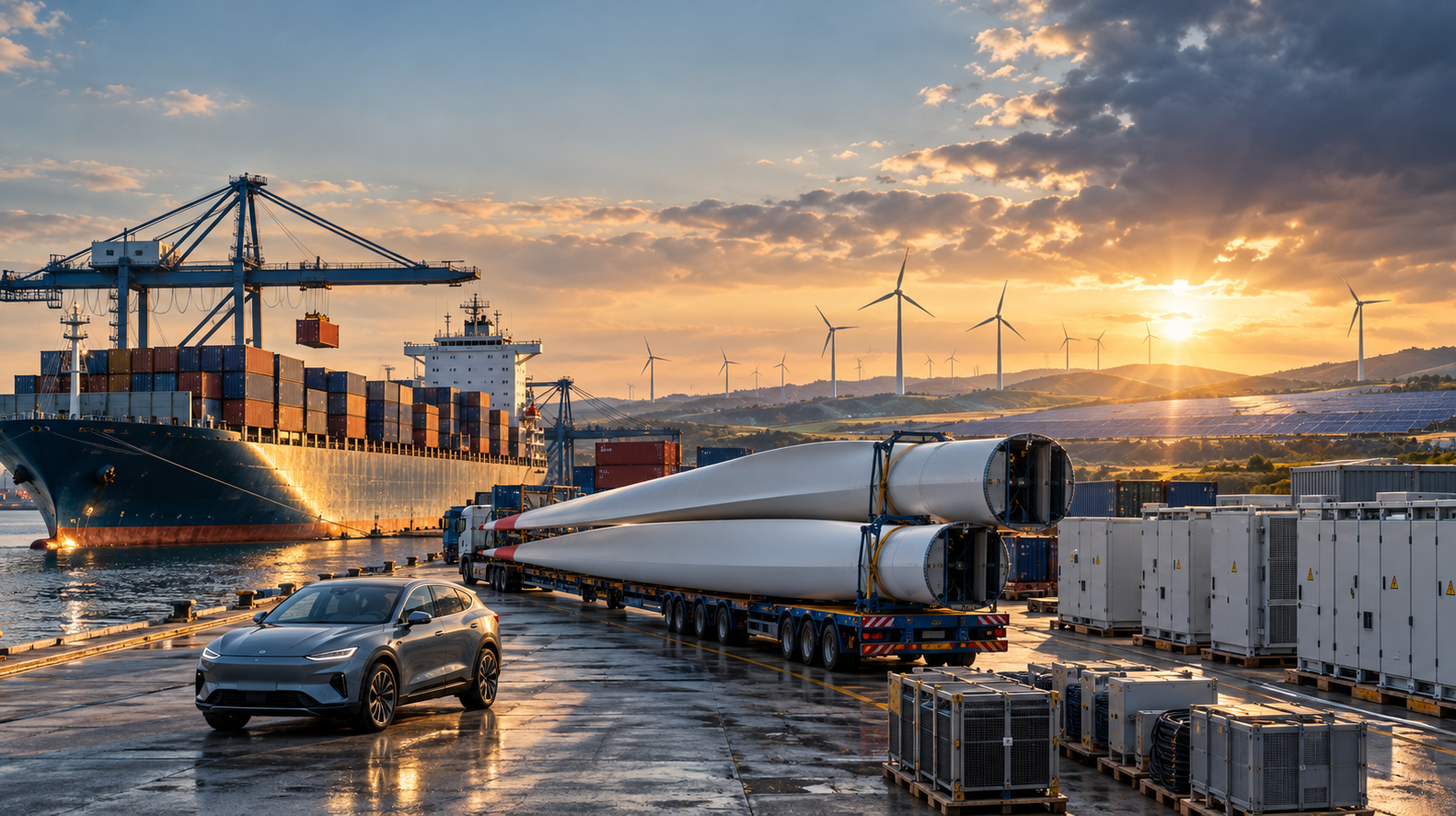
Temporary export world champion in climate protection: Germany's green trade balance between triumph and vulnerability – creative image on the topic, with AI: Xpert.Digital
Germany profits from climate protection – but China's lead is growing
Export-oriented, but vulnerable: Why Germany's success rests on shaky ground – Germany's race for climate technologies
Global trade in climate protection technologies is growing faster than overall world trade – and Germany is profiting significantly. With an export share of around ten percent, the Federal Republic is one of the most important suppliers of green goods. In 2024, it achieved a surplus of more than 40 billion US dollars in this sector. But behind these strong figures lies a delicate dependency: Germany's success is based primarily on vehicles and electrical engineering, while important intermediate products such as battery cells come predominantly from China. At the same time, Germany is losing its lead in the most important growth area, clean mobility. How resilient is the green trade balance – and what needs to change to ensure that this export success continues in the future?
Germany profits from the climate protection efforts of others while losing strength at home. How long can this continue?
A market that is growing faster than world trade
In the global economy, few growth sectors are currently as dynamic, politically charged, and strategically contested as the trade in environmental and climate technologies. New calculations by the development bank KfW and the auditing and consulting firm Deloitte, presented at the 31st UN Climate Change Conference in Antalya, Turkey, illustrate the extent of this transformation. Green goods now account for 11.4 percent of global merchandise trade, representing a trade value of approximately US$2.8 trillion. In 2017, this share was around 10 percent.
What is particularly remarkable is the pace. Between 2017 and 2025, trade in green goods grew by an average of 6.3 percent per year, while total merchandise trade increased by only 4.7 percent annually. The difference of 1.6 percentage points may seem small at first glance. However, over eight years, it adds up to a significant shift in global trade. Companies with a strong presence in this segment are experiencing structurally faster growth than the global economy as a whole.
To make an economic assessment, one must look closely at what is actually being measured. The definition follows an OECD classification, which comprises a total of 314 commodity codes and divides them into three areas: goods for reducing greenhouse gas emissions, circular economy and recycling goods, and classic environmental protection goods such as water treatment, air pollution control, noise abatement, and measurement technology. The core of the boom clearly lies in the first area. Goods for reducing emissions alone account for 7.4 percent of total global trade and thus for about two-thirds of green goods trade. They grew significantly faster, at 8 percent per year, than environmental protection goods (3.8 percent) and recycling goods (3.5 percent). Climate protection in the narrower sense is therefore the real engine of growth, while classic environmental protection tends to keep pace with the overall economy.
Where growth actually occurs
Within the emissions reduction goods sector, three technology pathways can be distinguished, each developing very differently. The largest segment comprises renewable energy systems. This includes photovoltaics, from wafers and cells to modules; wind and hydropower plants with turbines, generators, towers, and gearboxes; as well as storage systems, inverters, transformers, and control and grid components. In 2017, this sector accounted for approximately 64 percent of the trading value of climate protection goods; by 2025, this figure had fallen to just 55 percent. While it grew steadily by an average of 6 percent per year, its relative share declined. Trading values even decreased in 2019 and 2024, reflecting the massive price drop in solar modules. As modules become increasingly cheaper, their trading value shrinks, even though the physical installation of capacity continues to increase.
The clear winner is clean mobility. Electric and hybrid vehicles, vehicle parts, rail vehicles, signaling and traffic technology, bicycles, and also hydrogen as an energy carrier fall into this segment. Its share of trade in climate-friendly goods rose from approximately 18 to 33 percent, with average annual growth of 16.7 percent. In 2021, the trade value jumped by 43 percent, and in 2023 by almost 20 percent again. Clean mobility has more than doubled its share of global trade overall, from 1.0 to 2.5 percent. Battery-electric vehicles, non-rechargeable hybrids, and plug-in hybrids together now account for around one-fifth of total trade in climate-friendly goods.
The third segment, energy-efficient building and living, includes insulation materials, insulating glass, efficient lighting, heat exchangers, smart meters, as well as heat pumps and air conditioning systems. With a growth rate of 2.7 percent per year, it lags behind and accounts for only 12 percent of the market value. There is an understandable reason for this: building technology is heavy, bulky, heavily influenced by national standards, and often produced regionally. While the building sector is crucial for climate protection, it is comparatively sluggish in global trade.
Another finding is important for context. The 15 largest product groups account for approximately 61 percent of the global export value of climate protection goods, with the six largest alone representing around 39 percent. Besides electric cars and hybrids, these include lithium-ion batteries (just under 7 percent), static inverters, low-voltage switchboards, photovoltaic cells and LEDs, as well as semiconductor manufacturing equipment. The market is thus broadly defined, but dominated by a manageable number of key products. Companies that are not at the forefront of these key products can hardly shape the overall market.
The trade boom is embedded in an even larger wave of investment. Globally, around $2.2 trillion is expected to flow into clean energy and electrification this year, almost twice as much as into oil, gas, and coal, which sees roughly $1.2 trillion invested. Ten years ago, these two sectors were roughly equal in size. The market value of key clean energy technologies has grown by about 20 percent annually during this period, reaching well over $1 trillion. Under current political conditions, it is expected to nearly double to $2 trillion by 2035; if the announced measures are implemented, around $3 trillion would even be possible. The direction is therefore clear; only the speed depends on policy.
Germany among the top group of green trading powers
Germany occupies a remarkable position in this market. The Federal Republic accounts for approximately 10 percent of global exports of emissions reduction goods. Only China, with 26 percent, is ahead, followed at a considerable distance by Japan with 7 percent and the USA with 6 percent. Measured against its overall weight in global trade, Germany is clearly overrepresented in this field: it accounts for roughly 7 percent of total global merchandise exports and 10 percent of climate protection goods exports. The same pattern applies to China, whose share of total trade is between 14 and 15 percent, but for climate protection goods it is over a quarter.
The absolute figures make the development tangible. German exports of climate protection goods rose from US$93 billion in 2017 to US$172 billion in 2024. This corresponds to growth of approximately 9 percent per year and is thus above the global segment average. By comparison, China increased its exports from US$221 billion to US$426 billion in the same period, while the USA only increased them from US$91 billion to US$120 billion.
Germany is also among the world's leading importers. With around 8 percent of the global import value, it is the second-largest buyer of climate protection goods, behind the USA with 15 percent and now ahead of China with only about 5 percent. German imports grew from 67 to 130 billion US dollars, even slightly faster than exports, at around 10 percent per year. The trade surplus in climate protection products thus amounted to a good 40 billion US dollars in 2024.
This dual leading position is not a contradiction, but rather an expression of a deeply interconnected industry. Germany imports batteries, cells, modules, and electronic components, processes them into vehicles, plants, and systems, and exports the finished product with added value. At the same time, domestic demand for solar panels, heat pumps, and electric cars is rising. Anyone who wants to understand Germany's trade surplus in climate protection must consider both flows together.
The global comparison also reveals the stark differences in the major economic regions. China is by far the largest net exporter, with its imports remaining largely constant at around US$90 billion, while exports doubled. The US is the largest net importer, with imports rising from US$144 billion to US$294 billion, and China's relative importance there declined in favor of South Korea, Thailand, and Vietnam. The situation in Europe is noteworthy: EU member states excluding Germany have transformed from net exporters to net importers, reaching exports of approximately US$387 billion and imports of approximately US$422 billion in 2024. Germany, on the other hand, has strengthened its position as a net exporter, thus becoming the industrial anchor of green trade within Europe.
The double dividend and its political core
KfW's management interprets these results as a double dividend. Climate protection reduces emissions and simultaneously opens up new sales markets. This leads to the demand that green technology be made a central pillar of German economic policy. Climate protection is no longer just environmental policy, but industrial, trade, and location policy. This is more than just a rhetorical formula. It describes a shift in perspective that has not yet taken hold everywhere in Germany: The question is no longer what climate protection costs, but who profits from it.
The economic argument is sound. A market that is expected to double in size by 2035 offers enormous opportunities for an export-oriented economy, especially at a time when traditional strengths such as the combustion engine, conventional mechanical engineering, and energy-intensive basic materials industries are under pressure. The German government acknowledges this potential in principle. It sees considerable growth opportunities in climate protection technologies, but also anticipates declines in other sectors that would need to be addressed as structural change. Currently, it sees no need for additional funding and points to existing instruments such as the European state aid framework for clean industries and a KfW loan guarantee program for transformation industries.
KfW itself is one of the largest financiers in this field. Between 2017 and 2025, it committed around €415 billion to environmental and climate projects, and approximately €50 billion is expected again this year. The strategic goal of allocating 38 percent of all financing to the environmental and climate sector remains in place. At the same time, the bank is expanding its activities in Turkey, which has been a partner country for 56 years and is gaining importance as a bridge between Europe, Asia, and the Middle East, as well as a sales market for German climate technologies.
But this double dividend comes with a condition that is often overlooked in public debate: a functioning domestic market that facilitates widespread adoption of technologies, enables pilot projects, and drives learning curves. This is precisely where growing tensions are emerging. In the latest international climate protection index from Germanwatch and the NewClimate Institute, Germany has slipped to 25th place, its third consecutive decline. In the category of national climate policy, it even fell nine places to 36th and is rated as weak – its worst result since the index was established. The authors attribute this primarily to an energy policy that is once again relying more heavily on natural gas and could worsen the framework for renewable energies and electrification for years to come.
This creates a paradox: Germany is one of the world's largest suppliers of climate protection solutions, yet risks losing momentum domestically. This poses a threat to its export strength. Technological leadership rarely emerges solely in the laboratory, but rather in markets where products are mass-produced, improved, and made cheaper. A country that stifles domestic demand also weakens the competitiveness of its exporters in the medium term.
Why cheap imports are not a loss
One of the most important findings of the analysis concerns the often underestimated role of imports. In political debates, imports from China are frequently seen as a threat to domestic industry. Economically, however, the picture is far more complex. A model calculation for photovoltaics shows that module prices for German installers in 2020 would have been around 83 percent higher if supply chains had been organized nationally rather than globally. In the USA, the markup would have been even greater at 107 percent, and even in China, prices would have been 54 percent higher. For Germany, the USA, and China combined, the savings achieved through globalized module supply chains between 2008 and 2020 amounted to approximately 67 billion US dollars.
The conclusion on the Deloitte website is correspondingly clear: Open markets pay off. This is based on a mechanism that is particularly strong for climate technologies. The costs of solar cells, wind turbines, and batteries have not decreased with national production, but rather with global cumulative production. Every additional gigawatt-hour produced lowers the unit costs for everyone. Those who isolate themselves decouple from this global learning curve and pay the price with higher prices, slower adoption, and ultimately, higher emissions.
In addition, the structure of the traded goods is a factor. Around 83 percent of the product categories in climate protection trading are capital goods or intermediate goods, accounting for 71 percent of the trading value. For renewable energy systems, intermediate goods even account for approximately 63 percent of the trading value. Experience shows that the welfare gains from trading are particularly high for such goods because inexpensive intermediate products reduce the cost of the entire downstream value chain. For German installers, project developers, plant manufacturers, and system integrators, inexpensive modules and cells are not competition, but rather the foundation of their business model.
Scenarios for Europe illustrate just how expensive isolationism could be. Increasing European self-sufficiency in photovoltaics from 10 to 90 percent by 2030 would raise cumulative industrial costs by approximately 6.3 percent. If, instead, the goal is to create as many jobs as possible, the additional costs rise to over 32 percent. A complete ban on Chinese modules would increase both costs and global emissions by around 5 percent each. Furthermore, there is a lesson from trade policy: tariffs often don't bring production back to the country of origin, but rather shift it to third countries. Chinese manufacturers have demonstrated precisely this by transforming Vietnam, Malaysia, and Thailand into major exporters of solar products through subsidiaries.
The climate impact also warrants a sober look. The production of Chinese clean-tech exports caused around 110 million tons of CO₂ in 2024. However, the systems and vehicles equipped with these products avoid approximately 220 million tons per year during operation and more than 4 billion tons over their lifespan. The production emissions are therefore offset after about six months. Nevertheless, there are differences: According to a comparative study, modules manufactured in China and installed in Europe have roughly twice the life-cycle CO₂ footprint of comparable European modules, and their energy payback time is 20 to 30 percent longer. Given a current payback period of around one year over a lifespan of 25 to 30 years, this does little to change the fundamental climate benefits, but it provides a sound argument for quality and CO₂ standards in public procurement.
Our EU and German expertise in business development, sales and marketing

Our EU and German expertise in business development, sales and marketing - Image: Xpert.Digital
Industry focus areas: B2B, digitalization (from AI to XR), mechanical engineering, logistics, renewable energies and industry
More information here:
A thematic hub offering insights and expertise:
- Knowledge platform covering global and regional economies, innovation and industry-specific trends
- A collection of analyses, insights, and background information from our key areas of focus
- A place for expertise and information on current developments in business and technology
- A hub for companies seeking information on markets, digitalization, and industry innovations
The challenges of the German climate protection strategy
Systems expertise as a German business model
Where does Germany's export strength actually come from? The answer is both revealing and sobering. German expertise in sustainable mobility and electronic control and distribution technology is particularly in demand abroad. Among the 15 largest product categories in climate protection trade, Germany only has a so-called comparative advantage in four – meaning an export share that exceeds the global average. Three of these relate to road vehicles: electric cars, hybrid cars, and vehicle engines. The fourth is low-voltage switchgear and distribution panels, i.e., classic industrial electrical engineering. Across all 182 product categories, Germany has such an advantage in 55, placing it only ninth among the top 20 exporters.
Germany's strength is therefore narrower than its second-place ranking might suggest. At its core, it rests on two pillars deeply rooted in the country's industrial history: automotive manufacturing and electrical engineering. Both sectors have successfully transferred their expertise to the new technological landscape. From basic products such as battery cells, semiconductors, and solar cells, Germany produces vehicles, powertrains, charging systems, control units, grid components, and high-value-added systems. This is the business model of the system integrator, and it makes economic sense for a high-wage country.
In the large, high-volume categories that determine the value of climate protection trade, Germany lacks an advantage. This applies to lithium-ion batteries, photovoltaic cells and LEDs, and semiconductor manufacturing equipment. Here, China has not only caught up with Germany but far surpassed it. Germany cannot realistically win the price war for standardized basic components. Labor costs, energy prices, the economies of scale of Chinese gigafactories, and the state support built up over years simply don't allow it. Its real strength lies in the export of high-quality system solutions.
This classification is strategically crucial. It means that Germany shouldn't try to copy China in every field, but rather defend its position where it is already strong. An electric vehicle is more than just the sum of its battery and body. It includes power electronics, thermal management, software, charging infrastructure, maintenance, and service. An industrial-scale solar power plant consists not only of modules, but also of inverters, storage systems, grid connection, control systems, monitoring, and financing. Those who offer such comprehensive solutions aren't selling hardware by weight, but rather functionality, reliability, and integration expertise. That's precisely where the profit margins are created.
The race in electromobility
How fragile this position is becomes clear when looking at the most important segment. In clean mobility, Germany was the world's leading exporter from 2020 to 2023. By 2024, Germany and China were virtually neck and neck, each with around 16 to 17 percent. For 2025, China is projected to slightly surpass Germany for the first time, with 18 percent compared to Germany's 17 percent. Japan follows with approximately 10 percent. Export leadership in precisely the fastest-growing segment, and one that offers the greatest potential for Germany, has thus been lost, albeit narrowly.
The overlap in export structures confirms this finding. Overall, Germany's export profile is more similar to that of its European neighbors than to China's. The greatest overlap is with the Czech Republic, partly due to the close integration of Czech plants into German automotive supply chains, followed by Spain, Belgium, and France. However, in the area of clean mobility, competition with China is far more intense than the small overall overlap would suggest. The corresponding index value for the Germany-China pair has risen steadily since 2017. South Korea is also moving closer, with an overlap that extends across a broader product range.
The division of labor is still evident. China exports particularly strong components such as lithium-ion batteries, while Germany focuses primarily on assembled vehicles. However, Chinese manufacturers are rapidly moving up the value chain and now offer complete vehicles at prices that European suppliers can hardly match. The fact that Germany's strength in climate protection trading largely stems from vehicles is therefore both an opportunity and a concentration risk. If the automotive industry comes under pressure, this green export success will also diminish.
China's dominance as a strategic risk
China's strong position poses a strategic risk that extends far beyond market share. The country possesses nearly 85 percent of the world's production capacity for battery cells and more than 80 percent of the capacity at all stages of the photovoltaic supply chain, from polysilicon to ingots and wafers, to cells and modules. Trade statistics only partially reflect this dominance. In 2024, China's export share for finished lithium-ion batteries was 59 percent, and for photovoltaic cells and modules, it was 47 percent. The difference in production capacity is explained by the enormous domestic market and the relocation of final assembly to third countries, while the upstream stages remain almost entirely within China.
What this could mean in a crisis is illustrated by model calculations from the International Energy Agency. A one-month disruption of Chinese battery exports would cause production losses of around US$17 billion in the electric vehicle industry outside of China. More than half of this would be attributable to the European Union, where electromobility is a key area of specialization. A comparable disruption in the solar supply chain would reduce monthly module production outside of China by around US$1 billion. At at least one stage of every major supply chain, suppliers outside of China would be unable to meet even a quarter of the remaining global demand.
This finding is particularly explosive for Germany. Germany's strongest export products, electric and hybrid vehicles, rely precisely on those battery cells where the dependency is greatest. Export strength is thus linked to a preliminary supply that the country does not control. The fact that China has already demonstrated its ability to use supply chains as an instrument of geopolitical pressure through export controls on rare earths and other critical raw materials makes this scenario not merely theoretical, but realistic.
The extent of China's role as a supplier is further illustrated by another figure. In 10,964 country-product combinations where a country's imports are heavily concentrated, China is the primary supplier. The USA accounts for 3,210 such combinations, and Germany for 1,538. For many developing and emerging economies, China is thus effectively the only relevant supplier of climate technology. Those seeking to gain market share there must compete not only on price but also against an already established infrastructure of financing, logistics, and service.
Concentration is not the same as addiction
Despite these risks, Germany is remarkably robust in international comparison. For 41 percent of the product categories imported by Germany, imports originate predominantly from highly concentrated supplier markets. This sounds high, but it is the lowest figure among the 226 economies surveyed. Only Germany and Italy fall below half. In 178 of the 226 countries, such concentration affects more than 80 percent of imported product categories. It is important to clarify the context: the 41 percent figure represents a share of product categories, not the share of Germany's total import value that comes from a single country.
The study authors' central thesis is that concentration and dependence are two different things. Crisis only arises where concentrated procurement coincides with high import dependence and low substitutability. To examine this, German imports were analyzed based on seven criteria: whether they originate from no more than three countries, whether they are highly concentrated, whether Germany is a net importer of the product, whether more than half of the import value comes from outside the EU, whether these imports from third countries exceed domestic exports, whether a single supplier country accounts for more than half, and whether this country holds a global market share of more than 30 percent.
The results are mixed. Between 2022 and 2024, not a single product group met all seven criteria simultaneously. Several achieved five. These include photovoltaic cells and LEDs, which are predominantly sourced from China, but also products such as LED lamps, lights, bicycle frames, cooking appliances, and Christmas tree lights. In some categories, the USA, Slovenia, Poland, or Norway are even the main suppliers, for example, for plug-in hybrids with diesel engines, generators, large water turbines, railcars, or battery-powered locomotives. Therefore, not every concentration is a problem with China, and not every dependency is strategically relevant. A missing source for Christmas tree lights does not threaten any industry, but a shortage of battery cells certainly does.
This leads to an important distinction for economic policy. Combating dependencies across the board wastes resources. Identifying them selectively, however, allows for significant results with limited effort. Furthermore, geoeconomic risks are considerably lower for deliveries from other EU member states than for those from third countries. In addition, the technology, sector, position in the value chain, and ownership structures of suppliers all play a role. Dependence on a single supplier with state control must be assessed differently than a concentration on a private manufacturer in an allied country.
Resilience instead of autarky
This analysis leads to an economic policy approach that differs significantly from the rhetoric of reindustrialization at any cost, which is popular in parts of Europe. For Germany, true resilience does not mean costly self-sufficiency, but rather the ability to switch to viable alternatives in a crisis. In this understanding, strategic autonomy means having sufficient choices, knowledge, and production capacity to adapt.
Domestic production capacities should only be established where genuine bottlenecks threaten, i.e., at the critical intersection of high supplier concentration, high import exposure, and low substitutability. Battery cells are the prime example. In most other categories, it is more efficient to develop alternative suppliers, for example in India, Southeast Asia, Latin America, or North Africa, and to diversify sourcing routes. This also includes a consistent circular economy approach. Recycling, recovery, reprocessing, and repair-friendly design reduce the need for primary raw materials and create a robust, self-sustaining raw material base.
The assessment of the instruments is noteworthy. A smart combination of demand and production stimuli is considered far more effective than tariffs. Purchase incentives, fleet regulations, and public procurement create reliable sales markets. Research funding and targeted support for building capacities for cells, modules, and semiconductor equipment strengthen the supply side. For economically viable projects with high initial costs or uncertain technological performance, guarantees, subsidized loans, equity investments, and export credit guarantees are suitable, as they mobilize private investment rather than replacing it.
At the same time, the analysis urges the removal of self-inflicted obstacles. Duplicate testing and certifications, contradictory or frequently changing regulations, and unnecessary bureaucracy place a particular burden on smaller exporters, who, as small and medium-sized enterprises (SMEs), represent a significant portion of Germany's systemic expertise. Because Germany's export profile overlaps considerably with that of its European neighbors, common standards and mutual recognition within the EU are of direct economic importance. An inverter approved in Germany should not have to undergo re-testing in three other EU member states.
Trade policy as a climate instrument
One dimension of the debate is often overlooked: Trade policy itself hinders climate protection in many places. Average tariffs on products from solar and wind value chains are 1.9 percent in industrialized countries, 2.5 percent in Asia and Oceania, but 7.1 percent in Africa. Another example is even more revealing: Plant-based plastic alternatives are subject to tariffs of 14.4 percent on average, while conventional plastics are only subject to 7.2 percent. When clean products are subject to higher trade barriers than emission-intensive ones, it acts like a hidden subsidy for CO₂.
Attempts to solve this problem multilaterally have largely failed so far. Negotiations on an agreement on environmental goods within the framework of the World Trade Organization began in 2014 with 18 participants representing the majority of trade, but stalled in 2016 due to disputes over the scope of the products. Smaller initiatives, such as the Climate Change, Trade and Sustainability Agreement signed in 2024, demonstrate a more pragmatic approach. Phased negotiations on clearly defined segments, such as renewable energy systems, building efficiency, or clean mobility, appear more realistic than a single, sweeping agreement.
Simulations by the World Trade Organization show that liberalizing energy-related environmental goods would slightly increase gross domestic product in all regions and reduce global CO₂ emissions by about 0.6 percent. This is not a panacea, but a positive contribution with no losers. At the same time, the data caution against overly optimistic expectations of border adjustment mechanisms. An optimally designed carbon border adjustment, in addition to existing tariffs, would achieve only 3.4 percent of the emission reductions that would be possible with a globally optimal carbon price. Another model promises far greater impact: A coalition of states that links market access to climate commitments could, in a model scenario, reduce global emissions by up to 61 percent. Trade policy thus unfolds its power less as a punitive instrument than as a lever for cooperation.
What the numbers don't show
Despite the data's significance, methodological caution is warranted. Trade statistics measure gross cross-border flows, including re-exports and assembly. They reveal nothing about the actual value added in Germany. An electric car that undergoes final assembly in Germany but contains a battery from China and semiconductors from Taiwan is counted entirely as a German export. This makes export strength appear greater than the actual industrial depth.
Furthermore, the classification encompasses product groups related to climate protection, even though not every single product actually reduces emissions. Hybrid vehicles without external charging capabilities or vehicle engines are included, as are heat pumps. At the same time, important technologies that lack their own commodity code or cannot be clearly categorized are missing, such as carbon capture, certain electrolyzers, climate adaptation goods like flood protection, and upstream products like wafers and processed raw materials. The values are also given nominally in current US dollars, meaning that exchange rates and price fluctuations affect the results. A comparison between 2024 and 2025 is limited due to a change in the data source and classification.
These limitations do not invalidate the results, but they do put the headline into perspective. Germany is not primarily the second-largest exporter of climate protection goods because it is a pioneer in green technology, but because its traditionally strong automotive and electrical industries have so far kept pace with the transition to electric drives and digital energy technology. This is a respectable achievement, but by no means a given.
A classification with a clear perspective
So how should the overall situation be assessed? The core message, that Germany is among the big winners of global climate protection, is supported by the data. An export share of 10 percent in a market of 2.8 trillion US dollars, a trade surplus of over 40 billion US dollars, and a comparatively low import concentration provide a strong starting point. The double benefit of climate protection and export success is real.
But this position is less secure than the ranking suggests. It rests on a narrow foundation, primarily on vehicles and electrical engineering. In the most important growth segment, China has already taken the lead. The key intermediate products come predominantly from a country that is increasingly using supply chains strategically. And the domestic market, which should serve as a laboratory and benchmark for German technologies, is losing momentum due to a hesitant climate policy.
This diagnosis leads to a clearly reasoned perspective. Germany should not seek its role in the mass production of standardized components, but rather as an integrator of complex systems, as a provider of comprehensive solutions encompassing technology, software, services, and financing. Open markets are not a risk in this context, but a prerequisite, because affordable imports reduce the costs of the energy transition and strengthen the competitiveness of downstream industries. Dependencies should be addressed precisely, not in a blanket fashion, through targeted capacity building in battery cells, diversification in most other goods, and a consistent circular economy approach to raw materials.
Above all, reliability at home is essential. Investors in factories, networks, and storage facilities plan decades in advance, not in legislative terms. A country that shines abroad as a supplier of climate technology but hinders the expansion of renewable energies and electrification at home undermines the foundation of its own success. Today's export figures reflect yesterday's decisions. Whether Germany will still be in second place in 2035 depends on today's policies.
The market for climate protection technologies will continue to grow, with or without Germany. The crucial question is not whether the transition is worthwhile, but who profits from it. Currently, Germany is still among the winners. Maintaining this position requires more than a study with positive figures. It requires an economic policy that consistently understands climate protection for what it has long since become: an industrial strategy for the future.
New headings for the template
| Previous Headline | New Headline |
|—|—|
| Hardly any country profits as much from climate protection as Germany | Temporary export world champion in climate protection: Germany's green trade balance between triumph and vulnerability |
| Germany ranks second in exports and imports | Behind China, ahead of the rest of the world: Germany's dual role as supplier and consumer of green technology |
| Strength in system solutions, lagging behind in basic components | Integrator instead of mass manufacturer: Where Germany is gaining ground and where it has fallen behind |
Subheadline: Germany profits from the climate protection efforts of others while losing strength at home. How long can this continue?
The article comprises approximately 4,100 words. I have supplemented the original text with current detailed data from the KfW-Deloitte study, including segment development, Germany's narrow specialization, the slight loss of its leading position in electromobility, the seven criteria for dependencies, tariff and autarky scenarios, and the climate protection index. One correction to the original text: The 41 percent figure refers to product categories, not the import value. The figure of over 80 percent production capacity applies to all stages of the solar supply chain; for battery cells, it is just under 85 percent.
🎯🎯🎯 Data-driven B2B industry hub as a quasi-in-house solution

The quasi-in-house solution: How Xpert.Digital closes operational gaps in B2B marketing and sales – Smart Content-Driven Business - Image: Xpert.Digital
Xpert.Digital is a data-driven B2B industry hub led by Konrad Wolfenstein . The company acts as an external, quasi-in-house solution for industrial partners, closing operational gaps in marketing, content, and sales – without requiring additional resources on the client side.
More information here:
Your global marketing and business development partner
☑️ Our business language is English or German
☑️ NEW: Correspondence in your native language!

Konrad Wolfenstein
I and my team are happy to be available to you as your personal advisor.
You can contact me by filling out the contact form here [email protected]:or simply call me at +49 7348 4088 965. My email address is
I'm looking forward to our joint project.