Global solar energy generation until 2023 – Difference between cumulative solar capacity and solar energy generation – Image: Xpert.Digital
🌍⚡ Understanding solar energy: The difference between capacity and generation
🌞 The difference between cumulative solar capacity and solar energy generation lies in their definition and application within the field of solar energy. Both terms are essential for understanding global developments and the actual use of solar energy to meet energy needs.
🌅 Cumulative solar capacity
definition
The cumulative solar capacity refers to the total installed capacity of solar power plants in a specific area or country. It is often expressed in megawatts (MW) or gigawatts (GW) and represents the sum of all installed photovoltaic systems. This figure thus describes the solar energy infrastructure and the potential that a region or country can generate clean energy from solar power.
Meaning
The cumulative solar capacity provides the basis for considering the potential success of solar energy. It indicates how much solar energy could theoretically be generated if all PV systems operated under optimal conditions (e.g., uniform solar irradiance without losses due to shading or weather conditions).
This figure is an important indicator for measuring developments and progress in renewable energies. Countries like China, the USA, and Germany have massively expanded their photovoltaic installations over the past two decades, which is reflected in their cumulative capacity. In many nations, an increasing cumulative capacity is a sign of political and economic efforts to move away from fossil fuels while simultaneously achieving climate goals.
Real-world example
Countries with high cumulative solar capacity, such as China and India, demonstrate that they have made immense investments in photovoltaic technology to sustainably meet increasing energy demands. China, a global leader in the solar industry, has invested billions in the development of solar power plants and decentralized solar solutions.
Challenges with cumulative capacity
However, the sheer number of cumulative capacity figures says nothing about the actual use or efficiency of the installed solar power systems. Technical challenges such as wear and tear, system aging, or environmental factors can reduce the actual energy production.
☀️ Solar energy generation
definition
While the cumulative solar capacity describes the theoretical potential of solar power plants, solar energy production expresses the actual amount of electrical energy generated. This value is measured in kilowatt-hours (kWh) or megawatt-hours (MWh) and thus precisely indicates how much energy was fed into the grid by the existing plants.
Meaning
Statistics on solar energy production reveal how efficiently the installed infrastructure is used in practice. They also provide valuable information on how effectively clean solar energy can replace fossil fuels. Solar energy production is directly dependent on environmental conditions such as solar irradiance, weather, location, and the technical efficiency of the modules.
Regions with high levels of solar radiation, such as North Africa, Australia, or the Middle East, can generally generate more solar energy than countries with less solar radiation, for example, in Northern Europe. Despite these geographical differences, technological progress shows that innovations make sustainable energy production possible even in regions with moderate solar radiation.
Factors influencing solar energy generation
- Solar radiation: The more intense and longer the sun shines on the modules, the higher the electricity production.
- Seasonality: Seasonal changes, such as longer nights in winter, can lead to fluctuations in solar energy production.
- Weather conditions: Cloudy days and periods of rain can significantly reduce production.
- Module efficiency: Advances in technology can optimize yields, even under poor environmental conditions.
Global Trends in Solar Energy Generation
By 2023, global solar energy production will have reached a record high, as innovations in PV technology and falling production costs are leading to a faster increase in generation figures. Modern “bifacial” solar modules, for example, which can absorb sunlight on both the front and back, have significantly increased energy yield. At the same time, intelligent inverter systems support the maximization of power generation through precise control.
🌍 Comparison: Capacity vs. Generation
Cumulative solar capacity and solar energy generation are closely linked, but they express different quantities:
- Cumulative solar capacity = Theoretical maximum power
- Solar energy generation = Energy actually generated
The cumulative solar capacity shows the technical potential of a country in the field of solar energy, without taking into account efficiency and actual utilization.
In contrast, solar energy production provides precise information about the utilization of this potential. For example, countries with high capacity (such as India) may produce less energy than smaller countries with modern technology due to weather conditions or outdated infrastructure.
⚡ Innovation potential in solar energy
The solar industry is a dynamic field characterized by continuous innovation. Some of the most important trends and developments include:
1. Better PV modules
The efficiency of solar modules has increased dramatically in recent decades. Modern modules achieve energy efficiency of up to 24 percent, while conventional technologies often reached only 15 percent. Perovskite solar cells, a novel type of solar cell, have the potential to surpass traditional modules in terms of both efficiency and cost.
2. Storage technologies
The expansion of battery storage systems makes solar energy available even at night. Lithium-ion and sodium-ion batteries are two technologies receiving significant investment to make solar power usable in the long term.
3. Smart Grids
Digitizing electricity grids allows renewable energies to be integrated more efficiently. Smart grids make it possible to balance fluctuations, control loads, and ensure security of supply.
4. Floating Solar
Floating solar power plants offer the possibility of installing large solar fields without using land. This technology is increasingly in demand, especially in water-rich countries such as Indonesia, the Philippines, and Brazil.
5. Agrivoltaics
An interesting combination of agriculture and solar energy. By installing solar panels on agricultural land, farmers can increase yields while simultaneously protecting their fields from extreme weather conditions.
🌟 Harnessing the potential of solar energy
Solar energy remains a central pillar of the energy transition and the global fight against climate change. Countries and companies are increasingly focusing on the rapid expansion of solar infrastructure and the development of innovative technologies to increase efficiency and scalability. In addition to reducing CO₂ emissions, solar energy offers numerous other advantages, including job creation and ensuring energy supply in remote regions.
To fully harness the potential of solar energy, strategies must be developed that optimize both cumulative capacity and maximize energy production. Thanks to technological advancements and increased international cooperation, the coming years could be crucial in sustainably meeting global energy demand.
🌞🌍⚡ Solar energy on the rise: The graphic that tells you everything about global development!
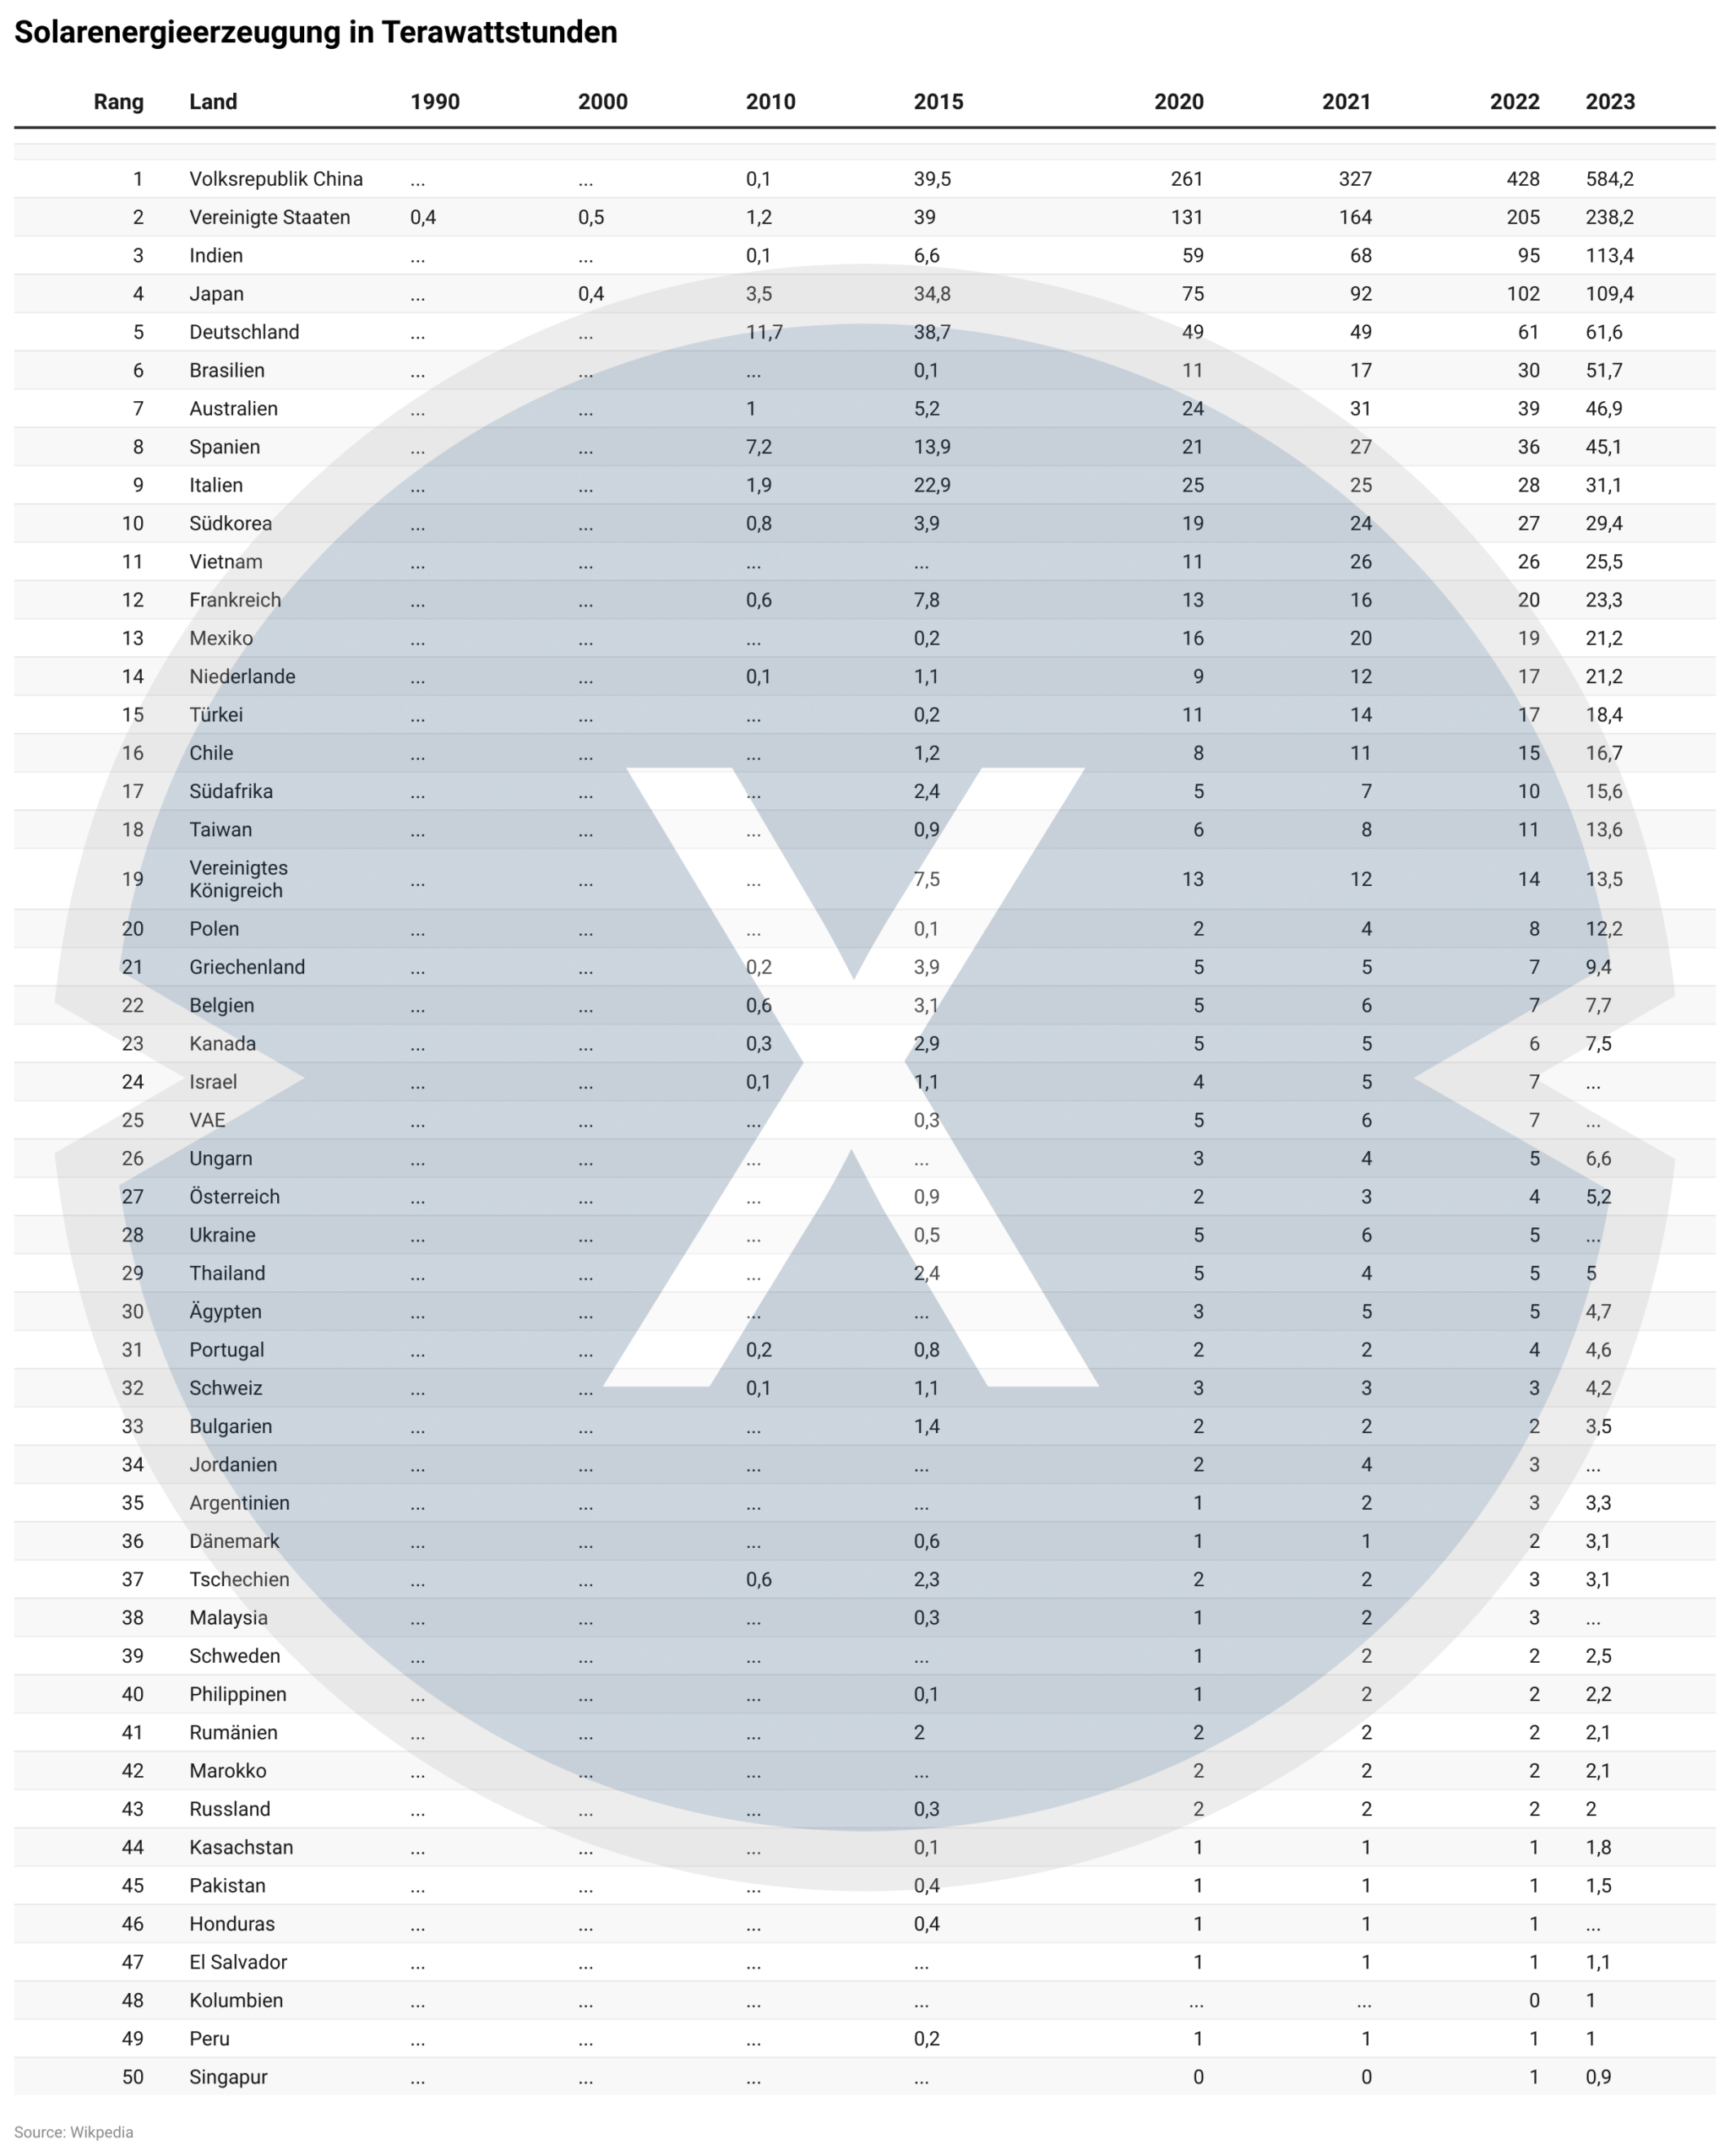
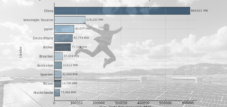
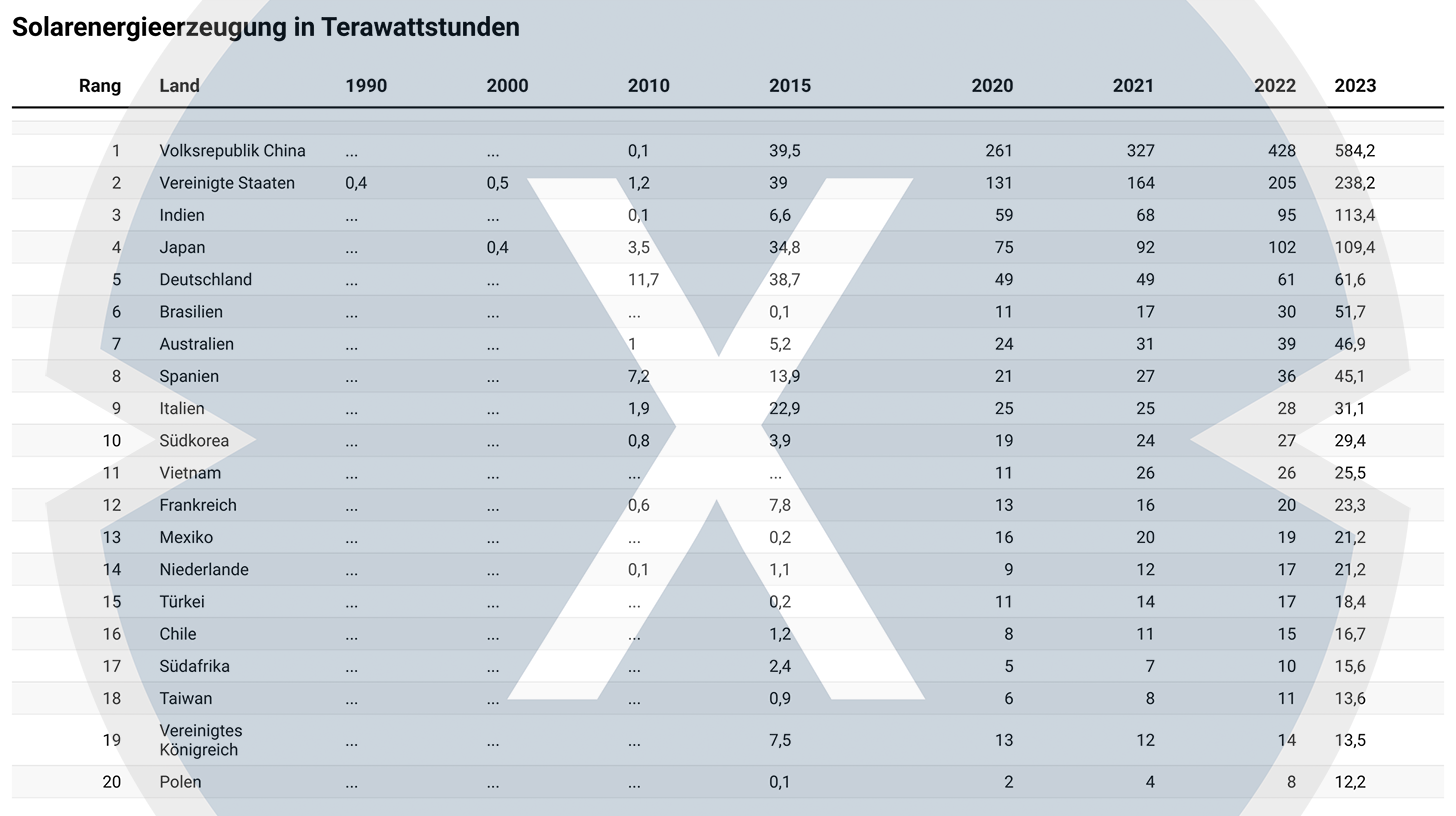
Top 50 countries worldwide with terawatt-hour solar energy production – Record growth in solar energy: The graphic that tells you everything about global development – Image: Xpert.Digital
🌞 The figures in the graphic on global solar energy production in terawatt hours (TWh) provide a deep insight into the development of solar energy over several decades. Here, the most important trends and findings from the data are analyzed and broken down:
🌏 1. China's Dominance
China has led the world in solar energy production for years. The rapid increase in recent years is particularly striking
- 2015: 39.5 TWh
- 2020: 261 TWh
- 2023: 584.2 TWh
This explosive increase demonstrates China's clear focus on expanding renewable energy. The Chinese market is driven by massive government investment, low production costs, and the use of large open spaces for solar parks. Particularly impressive is the increase of almost 100 TWh between 2022 (428 TWh) and 2023 (584.2 TWh).
🌟 2. United States: Stable expansion
The USA takes second place and is also experiencing impressive growth:
- 2015: 13.1 TWh
- 2020: 131 TWh
- 2023: 238.2 TWh
Growth in the US is driven by a combination of government support (e.g., tax breaks), private sector involvement, and favorable geographic conditions, particularly in the southwestern states. Notably, the US doubled its solar power generation between 2020 and 2023.
☀️ 3. India: Emerging Market
India ranks third and shows continuous growth dynamics:
- 2015: 6.6 TWh
- 2020: 59 TWh
- 2023: 113.4 TWh
India has ambitious renewable energy targets to meet the growing energy demand of its population and reduce its dependence on fossil fuels. The development of mega-solar power plants, such as those in Gujarat and Rajasthan, demonstrates the seriousness of India's commitment.
🌍 4. Germany: Europe's pioneer
Germany is a pioneer of solar energy in Europe, but shows slower growth compared to the global leaders:
- 2015: 38.7 TWh
- 2020: 49 TWh
- 2023: 61.6 TWh
Germany's focus is on utilizing rooftop installations and integrating solar energy into its already highly developed electricity grid. The slower growth is also due to the fact that Germany has fewer hours of sunshine than other countries and reached a high level of market saturation early on.
🌟 5. Second-tier countries
Some second-tier countries are showing remarkable progress:
🌴 Brazil
- 2020: 11 TWh
- 2023: 51.7 TWh
Brazil has shown impressive growth in recent years, driven mainly by the expansion of decentralized rooftop solar installations and government programs to promote renewable energy.
🌞 Australia
- 2015: 11 TWh
- 2023: 46.9 TWh
Australia makes optimal use of its abundant sunshine. The widespread use of rooftop solar installations by private individuals is a major contributor to this growth.
🌞 Spain
- 2015: 13.9 TWh
- 2023: 45.1 TWh
Spain has revived its renewable energy expansion after a period of reduced government support. The use of large solar parks in sunny regions like Andalusia is key to this growth.
🌴 Vietnam
- 2020: 11 TWh
- 2023: 29.5 TWh
Vietnam has experienced a rapid increase in solar energy production thanks to generous feed-in tariffs. This demonstrates how political measures can have a tremendous impact in the short term.
🚀 6. New markets and interesting developments
🌅 Mexico
- 2020: 16 TWh
- 2023: 21.2 TWh
Mexico is taking advantage of its geographical features, particularly in the desert regions of the north, to increase solar energy production.
🌻 Netherlands
- 2020: 9 TWh
- 2023: 21.2 TWh
Despite its small size, the Netherlands has achieved remarkable growth, mainly through the use of roof space and floating solar installations.
🌞 Chile
- 2020: 8 TWh
- 2023: 16.7 TWh
With its unique solar radiation in the Atacama Desert, Chile is a prime example of the efficient use of solar resources.
🌲 Canada
- 2020: 5 TWh
- 2023: 7.5 TWh
Canada's growth in solar energy remains comparatively low, due to climatic conditions and the strong availability of other renewable energy sources such as hydropower.
⏩ 7. Global Growth Dynamics
A comparison of global figures shows that solar energy production has accelerated significantly in recent years. While leading countries like China, the USA, and India continue to dominate, there is strong growth in second-tier countries, particularly in Asia, Latin America, and Africa. This demonstrates that solar energy is increasingly becoming a global phenomenon, and developing countries are also participating in this boom.
🔮 8. Forecasts for the future
Based on previous growth rates, global solar energy production could exceed 2,000 TWh by 2030. Particularly dynamic markets such as India, Brazil, and Vietnam will play a key role in this. At the same time, technological innovations such as higher efficiency and more cost-effective energy storage will further fuel this growth.
🌟 The figures show that solar energy production has transformed from a niche phenomenon into a key global factor in energy supply. China and other emerging markets, in particular, are driving this transformation at an impressive pace, while established countries like Germany and the USA continue to play a vital role.
📣 Similar topics
- 🌞 Solar energy on the rise: The leading nations and their figures
- 🇨🇳 China's Solar Power: How One Nation Dominates the World
- 🇺🇸 USA success story: Stable expansion of solar energy
- 🇮🇳 India's growth strategy: Solar energy as the future of energy supply
- 🇩🇪 Solar energy in Germany: Europe's early starters analyzed in figures
- 🌍 Global Trends: How the world is driving the solar revolution
- 📊 Facts and figures: Rapid growth in global solar production
- 🔮 Future forecasts: Solar energy production in 2030 exceeding 2,000 TWh?
- 🌟 New markets: Second-tier countries in focus for the solar industry
- 🛠️ Technological innovations: How progress is driving solar dynamics
#️⃣ Hashtags: #SolarEnergy #EnergyTransition #RenewableEnergies #GlobalTrends #FutureEnergy
Our recommendation: 🌍 Limitless reach 🔗 Connected 🌐 Multilingual 💪 Sales power: 💡 Authentic with strategy 🚀 Innovation meets 🧠 Intuition


From local to global: SMEs conquer the world market with a clever strategy - Image: Xpert.Digital
In an era where a company's digital presence determines its success, the challenge lies in creating an authentic, personalized, and far-reaching presence. Xpert.Digital offers an innovative solution that positions itself as the intersection of an industry hub, a blog, and a brand ambassador. It combines the advantages of communication and sales channels in a single platform and enables publication in 18 different languages. Cooperation with partner portals and the ability to publish articles on Google News and a press distribution list with approximately 8,000 journalists and readers maximize the reach and visibility of the content. This represents a crucial factor in external sales and marketing (SMarketing).
More information here:
We are here for you - Consulting - Planning - Implementation - Project Management
☑️ SME support in strategy, consulting, planning and implementation
☑️ Creation or realignment of the digital strategy and digitization
☑️ Expansion and optimization of international sales processes
☑️ Global & Digital B2B trading platforms
☑️ Pioneer Business Development

Konrad Wolfenstein
I would be happy to serve as your personal advisor.
You can contact me by filling out the contact form below or simply call me on +49 7348 4088 965 .
I'm looking forward to our joint project.
Write to me


Xpert.Digital - Konrad Wolfenstein
Xpert.Digital is a hub for industry focusing on digitalization, mechanical engineering, logistics/intralogistics and photovoltaics.
With our 360° Business Development solution, we support renowned companies from new business to after-sales.
Market intelligence, smarketing, marketing automation, content development, PR, mail campaigns, personalized social media and lead nurturing are part of our digital tools.
You can find more information at: www.xpert.digital - www.xpert.solar - www.xpert.plus
Keep in touch